The Treasury auction cycle, out of sample
The idea
The US Treasury auctions new 2-, 3-, 5-, 7-, 10-, 20-, and 30-year notes and bonds every month on a calendar it publishes well in advance, so everyone knows when supply is coming and roughly how much. Dong Lou, Hongjun Yan, and Jinfan Zhang (2013) found that prices fall before those auctions all the same and recover afterwards. From 1980 to June 2008, the yield of the on-the-run 2-year note rose by 2.53 basis points on average in the five days before a 2-year auction and fell by 2.32 in the five days after. The five-day return after the auction beat the five days before it by 8.9 basis points of price for the 2-year note (t 2.7), 22.5 for the 5-year, and 23.8 for the 10-year. Their explanation is that dealers, who absorb most new supply, have limited room on their balance sheets and sell ahead of the auction, while end investors are slow to step in.
They also showed what that was worth as a trade. Shorting the 2-year note against a duration-matched portfolio of 6-month bills and 10-year notes for the 10 days before each auction, then reversing the positions for the 10 days after, had an annualised Sharpe ratio of 1.08 over the whole sample and 1.44 from 1998 to 2008. They put the hidden cost to the Treasury at 9 to 18 basis points of the amount auctioned.
Michael Fleming, Weiling Liu, and Giang Nguyen at the New York Fed (2026) looked at the same thing intraday, using interdealer trades from 1991 to 2024. They found that yields rise in the hours before the auction and fall back after the results, by 0.7 to 1.2 basis points in all across maturities. Since 2015 the effect has been less than half as large as before, which they attributed partly to investment funds and other non-dealers buying more at auction directly. They found the same weakening over a 10-day window around each auction, so the multi-day cycle that Lou, Yan, and Zhang reported from a sample ending in 2008 is smaller in later years too.
Treasury futures are where most traders would act on this, and our futures data start in June 2010, two years after Lou, Yan, and Zhang’s sample ends and three years before the paper was published. So we asked the question again on later data: do the futures cheapen into auctions and recover afterwards, and is it worth trading? The data are out of sample for the original paper, but our own choices weren’t fixed in advance. We picked the windows, the futures, and the month-end adjustment below while looking at these years, and we say where that matters.
Data and method
We use 1,250 nominal note and bond auctions from 15 June 2010 to 30 September 2026, from the Treasury’s Fiscal Data service, with reopenings included and TIPS and floating-rate notes left out. Each auction is matched to the future its new security is most closely tied to:
| Auctions | Future | Week of the month | Auctions |
|---|---|---|---|
| 2-year notes | ZT | last | 196 |
| 3-year notes | ZT | second | 195 |
| 5-year notes | ZF | last | 196 |
| 7-year notes | ZN | last | 196 |
| 10-year notes | ZN (and TN from 2016) | second | 195 |
| 20-year bonds (from 2020) | ZB | third | 77 |
| 30-year bonds | UB (and ZB) | second | 195 |
| All | 1,250 |
The futures prices are continuous front-month series from our marketfeed archive, with daily settlements (struck at 15:00 New York time, two hours after most auctions) and one-minute bars built from trades.
For the daily test, the “before” window runs from the settlement six trade dates before the auction to the settlement the day before it, and the “after” window from there to the settlement four trade dates after the auction. Each window holds five daily returns, and the after window starts with the auction day. We report both windows and the gap between them (after minus before, in basis points of price), since a positive gap could come from a price that rose in both windows.
For the intraday test, each auction day is split at P0, the last trade before bids close, into three parts: the 150 minutes before it, the first five minutes after bids close (which usually take in the results), and the rest of the three hours after it. Each auction is compared with up to eight control days on the same weekday one to four weeks either side, measured at the same clock time, and leaving out days with other coupon auctions, FOMC announcements, or early closes.
Each auction counts as one observation in a t statistic, and we never pool maturities. The method notes at the end cover the sample exclusions, costs, yield conversions, and hedge ratios, and the checks we ran for dependence between neighbouring auctions.
The daily gaps line up with the end of the month
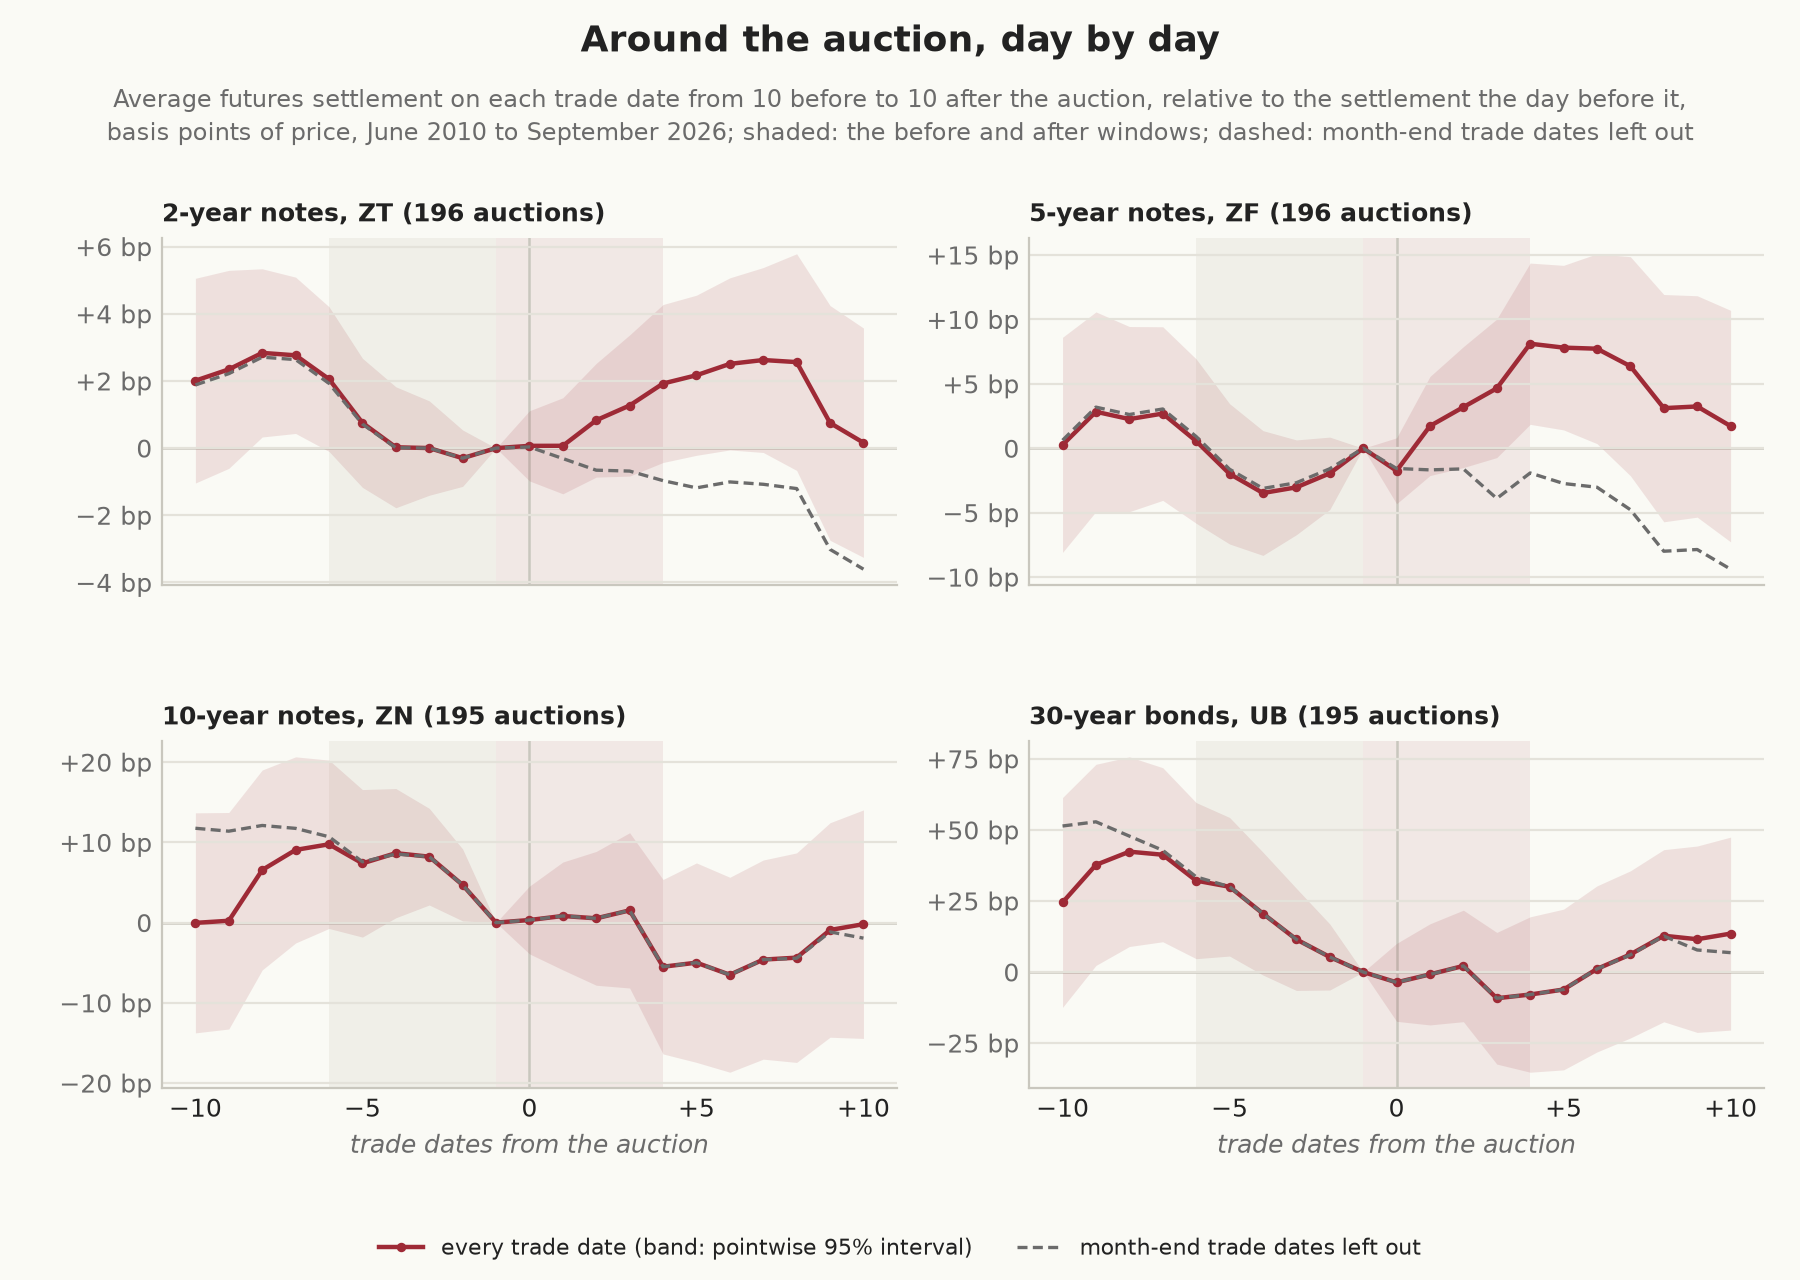
At first sight the pattern is there in the late-month auctions. Across the 196 2-year auctions, ZT fell 2.1 basis points of price in the before window and rose 1.9 in the after window, a gap of 4.0 (t 2.8, interval +1.2 to +6.8). The 5-year and 7-year auctions show larger gaps, but in a different way: ZF barely moved before the 5-year auction and rose 8.1 points afterwards, and ZN rose in both windows around the 7-year. The 2-, 5-, and 7-year notes are all auctioned in the last week of the month, so their after windows run through the turn of the month, and that’s when Treasuries rally.
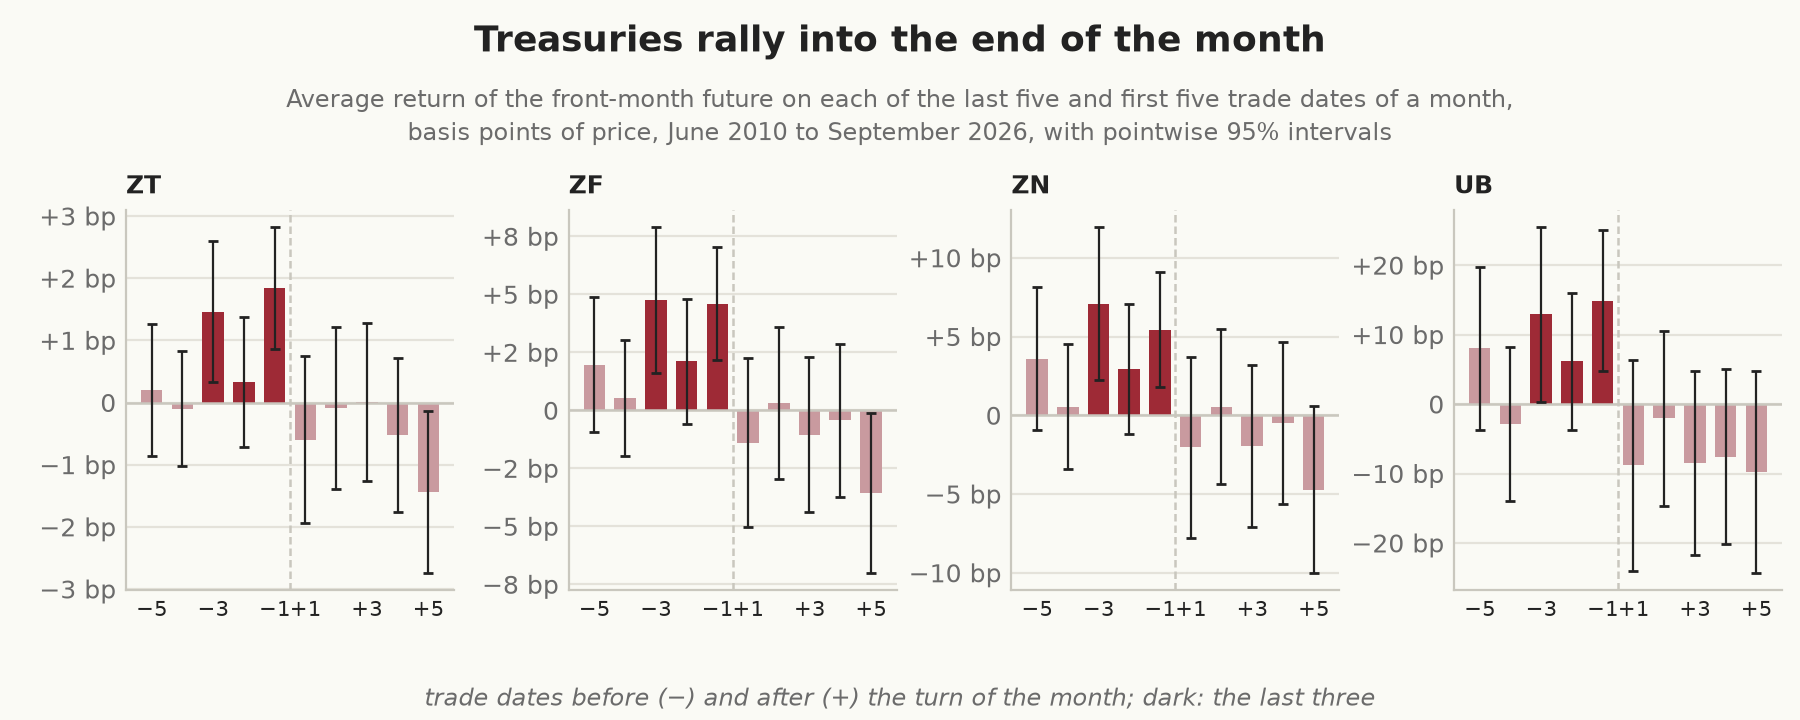
On the last three trade dates of a month, ZT gained 1.2 basis points a day on average (t 3.9), ZF 3.8 (t 4.7), ZN 5.2 (t 4.1), and UB 11.3 (t 3.5), while on every other day all four lost a little. The usual explanation is the duration extension of bond indices at month-end, when index funds and other benchmarked investors buy longer bonds to keep up with the index, though we haven’t tested that here. Once those three days are taken out of both windows, the gaps for the late-month auctions shrink to within about a standard error of zero:
| Auction | Future | Auctions | Before | After | Gap (t) | 95% interval | Gap without month-end days (t) | 95% interval |
|---|---|---|---|---|---|---|---|---|
| 2-year | ZT | 196 | −2.1 | +1.9 | +4.0 (2.8) | +1.2 to +6.8 | +1.0 (0.8) | −1.6 to +3.5 |
| 5-year | ZF | 196 | −0.6 | +8.1 | +8.7 (1.9) | −0.4 to +17.7 | −1.0 (−0.3) | −8.6 to +6.6 |
| 7-year | ZN | 196 | +3.0 | +12.1 | +9.2 (1.3) | −5.0 to +23.3 | −2.4 (−0.4) | −14.6 to +9.8 |
| 3-year | ZT | 195 | −1.5 | −2.3 | −0.8 (−0.4) | −5.2 to +3.5 | −0.2 (−0.1) | −4.6 to +4.1 |
| 10-year | ZN | 195 | −9.8 | −5.5 | +4.3 (0.6) | −10.5 to +19.1 | +5.2 (0.7) | −9.6 to +20.0 |
| 10-year | TN | 128 | −18.8 | −16.5 | +2.3 (0.2) | −21.8 to +26.4 | +4.1 (0.3) | −19.8 to +28.0 |
| 20-year | ZB | 77 | −13.8 | −2.1 | +11.7 (0.5) | −30.4 to +53.9 | +7.2 (0.3) | −35.0 to +49.4 |
| 30-year | ZB | 195 | −15.0 | −8.0 | +7.0 (0.5) | −21.5 to +35.5 | +7.8 (0.5) | −20.6 to +36.2 |
| 30-year | UB | 195 | −32.2 | −7.9 | +24.3 (1.3) | −13.8 to +62.3 | +25.6 (1.3) | −12.3 to +63.5 |
Basis points of price, settlement to settlement, five daily returns before the auction and five from the auction day on, auctions from June 2010 to September 2026 (TN from 2016, the 20-year from 2020). Month-end days are the last three trade dates of each month.
Removing those days locates the returns without explaining them: if the dealers’ selling were reversed on exactly those days, taking them out would remove a genuine auction recovery as well. What we can’t rule out is that the month-end rally is partly auction-related, because every month in the sample ends within a week or so of a 2-, 5-, and 7-year auction.
The calendars do overlap less than you might expect, though. Of the 980 trade dates in the 2-year after windows, 472 are month-end days and 508 aren’t, and 116 month-end days fall outside those windows. ZT’s month-end days earned 1.20 basis points a day inside the windows and 1.26 outside them, and its other days in the windows lost 0.37 a day, close to the 0.35 lost on days in neither. ZF around the 5-year auctions looks the same (3.7 inside against 5.0 outside on month-end days, and −0.84 on both sets of other days). The rally doesn’t need an auction to have just happened, and the days after an auction that aren’t at month-end look ordinary.
Our gaps are considerably smaller than the published cash estimates. ZT’s +4.0, with every day included, compares with Lou, Yan, and Zhang’s 8.9 for the 2-year note, and ZF’s +8.7 with their 22.5 for the 5-year. That comparison mixes futures with cash securities and two samples that each carry their own sampling error (the 2-year estimate had a t of 2.7), so all it shows is a smaller effect in futures since 2010.
UB is a different case: it fell 32 basis points in the five days before the 30-year auction (t −2.3), about 22 more than an ordinary five days away from month-end (t −1.6), and recovered none of it afterwards. Its gap of +25.6 without month-end days has an interval from −12 to +64, which is too wide to rule out a large effect either way.
Moving every auction 10 trade dates later gives placebo gaps within 1.7 standard errors of zero in every row. The gaps were larger in 2010 to 2013, the years right after Lou, Yan, and Zhang’s sample: 5.5 points in ZT (t 2.7) and 20.3 in ZF (t 1.8), but only 1.4 and 4.3 without month-end days. Using the last two trade dates as month-end instead of three leaves more behind (+2.4 in ZT, t 1.7, and +2.8 in ZF, t 0.7), and we only settled on three days after seeing the chart.
Lou, Yan, and Zhang hedged their 2-year trade against bills and 10-year notes, which takes out moves in the general level of rates. If we hedge ZT with ZN instead, then the 2-year gap falls to +1.1 (t 1.3, from mid-2011), and to +0.7 without month-end days. The hedge doesn’t remove the month-end effect completely, since ZT rallies a little more at month-end than its beta to ZN implies (0.4 basis points a day, t 1.9). Two hedged results stand out: ZF hedged with ZN around the 5-year auctions, a gap of +2.7 (t 2.5) or +1.3 (t 1.4) without month-end days, and ZB hedged with ZN around the 20-year auctions, +17.7 (t 2.6) from 77 auctions. They’re two of 18 hedged and unhedged comparisons, and we come back to what they’d earn as trades below.
The hours before the close of bidding
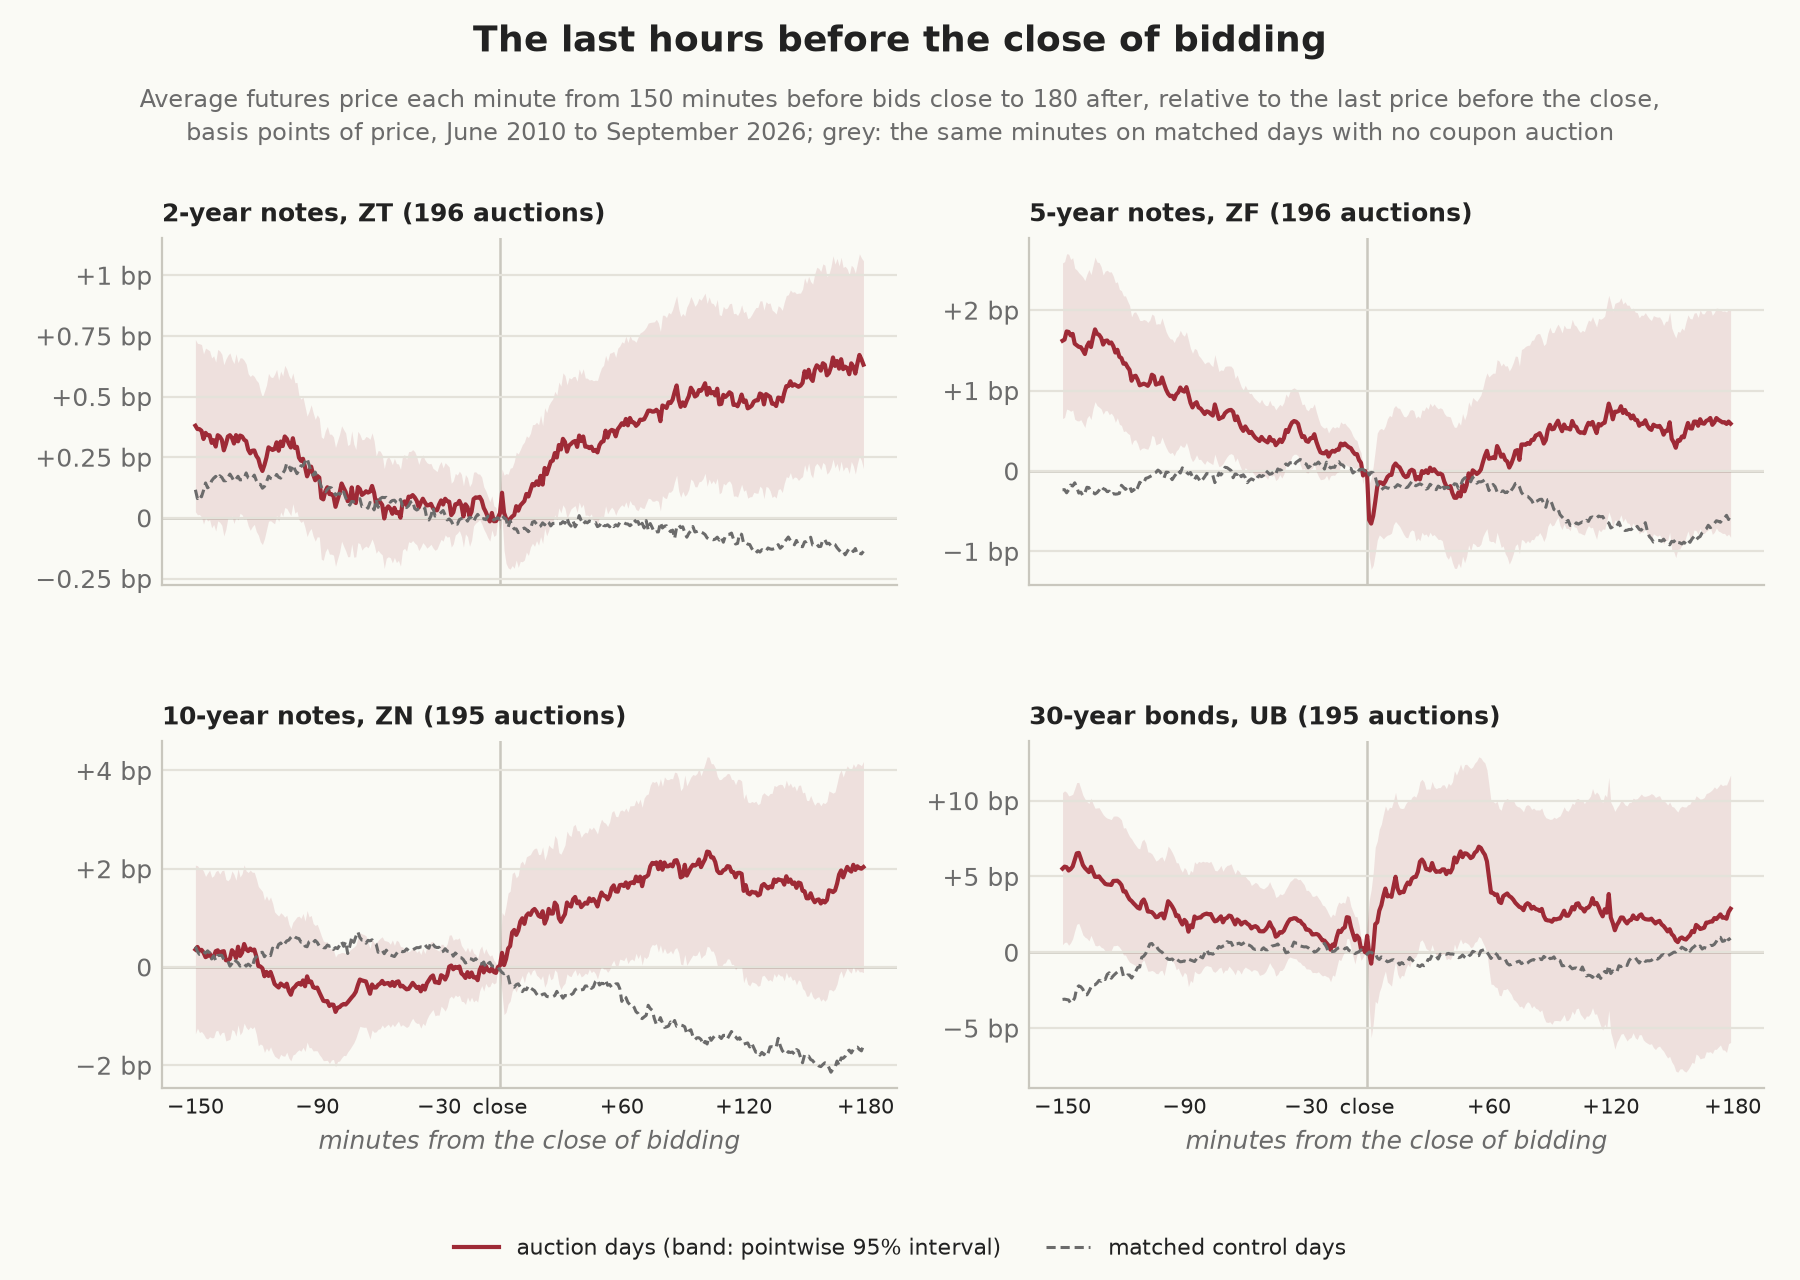
Measured against the matched control days, the swing is positive around every auction. Its ordinary 95% interval excludes zero for all but the 10-year in TN and the 20-year and 30-year in ZB, and UB’s only just does:
| Future (auction) | Auctions | 150 minutes before (t) | First 5 minutes after | Rest of the 3 hours (t) | Swing (t) | 95% interval | Swing in yield |
|---|---|---|---|---|---|---|---|
| ZT (2-year) | 196 | −0.25 (−1.2) | +0.03 | +0.74 (3.8) | +1.0 (3.4) | +0.4 to +1.6 | 0.6 bp |
| ZT (3-year) | 195 | −0.52 (−2.2) | −0.01 | +0.18 (0.8) | +0.7 (2.0) | +0.0 to +1.4 | 0.5 bp |
| ZF (5-year) | 196 | −1.98 (−3.3) | −0.31 | +1.44 (2.1) | +3.1 (3.3) | +1.3 to +4.9 | 0.8 bp |
| ZN (7-year) | 196 | −1.55 (−1.5) | +0.75 | +1.34 (1.6) | +3.6 (2.7) | +1.0 to +6.3 | 0.6 bp |
| ZN (10-year) | 195 | −0.37 (−0.3) | +0.56 | +3.07 (2.7) | +4.0 (2.4) | +0.8 to +7.3 | 0.5 bp |
| TN (10-year) | 129 | −1.30 (−0.6) | −0.83 | +4.30 (2.5) | +4.8 (1.8) | −0.6 to +10.1 | 0.6 bp |
| ZB (20-year) | 77 | +2.66 (0.7) | +0.91 | +2.21 (0.8) | +0.5 (0.1) | −7.8 to +8.7 | 0.1 bp |
| ZB (30-year) | 195 | −5.38 (−2.3) | +1.74 | −1.86 (−0.7) | +5.3 (1.5) | −1.6 to +12.1 | 0.3 bp |
| UB (30-year) | 195 | −8.72 (−2.8) | +1.89 | +0.05 (0.0) | +10.7 (2.0) | +0.2 to +21.2 | 0.5 bp |
Auction day minus the mean of its matched control days, basis points of price, June 2010 to September 2026. The swing is the fall before the close of bidding plus the rise after it. The yield column divides each auction’s swing by the future’s sensitivity at the time, so it leaves out auctions without 250 earlier trade dates of data (those before mid-2011, or before 2017 for TN).
UB’s swing is marginal on the ordinary calculation (t 2.0, interval +0.2 to +21.2), and the block bootstrap described in the method notes puts its interval at −0.4 to +20.0, so it doesn’t survive that check. The other swings whose ordinary intervals exclude zero still do under the bootstrap.
The swing is 0.5 to 0.8 basis points of yield in every contract but ZB, and it’s made up differently from one maturity to the next. In ZF and UB most of it is the fall before bids close, a rise in yield of about half a basis point. In ZT and the 10-year ZN the fall before is small, and most of the swing comes in the hours after the results. The first five minutes after bids close add little in ZT, ZF, and the 10-year, about a third of the rise after the close around the 7-year, and almost all of it in UB (+1.89 of +1.94). So UB’s pattern is weakness before the auction and a quick move straight after it, with no recovery over the rest of the afternoon. Leaving out the 11:30 auctions, or the 25 auctions on FOMC days, changes the ZT and ZF swings by at most 0.7 basis points of price and none of their signs.
The New York Fed’s 0.7 to 1.2 basis points is a different measurement, from cash Treasuries over 1991 to 2024 and with the window after the auction starting once the results are out, so our smaller numbers don’t show on their own that the effect has decayed. Within our sample, the swing was largest in 2010 to 2013 and smaller since 2020 (0.7 points of price in ZT and 1.6 in ZF, neither distinguishable from zero), and in UB it has been slightly negative since 2020.
Is any of it worth trading?
The intraday table compares each auction day with its control days, so what you’d make from trading it can be different. In ZF the swing is 3.1 basis points of price against the controls, while the future itself moved 2.3 on auction days, because the control days moved the other way over the same minutes.
The daily trade is the gap itself if you sell the future at the settlement six trade dates before the auction, reverse at the settlement the day before it, and sell at the settlement four trade dates after it. Paying one tick on each of the two round trips, it made 2.9 basis points of price a time in ZT around the 2-year auctions (t 2.0, Sharpe 0.49) and 7.3 in ZF around the 5-year (t 1.6, Sharpe 0.39). Simply buying each future for the last three trade dates of every month, with one round trip instead of two, did better: 3.1 a month in ZT (t 3.5, Sharpe 0.86) and 10.8 in ZF (t 4.6, Sharpe 1.13).
If we regress each auction trade’s return on that month’s month-end return, then the intercept, which is the auction trade’s average return beyond its month-end exposure, is 1.2 basis points in ZT (t 0.9, interval −1.3 to +3.8) and −2.2 in ZF (−9.9 to +5.6). So these two auction trades show no reliable return beyond their month-end exposure, although the intervals leave room for a modest positive one, and the test covers one pair of trading rules and one linear adjustment. The month-end trade’s own figures are flattered too, by our picking three days after looking.
The hedged versions pay costs on both contracts: ZT hedged with ZN, the closest to Lou, Yan, and Zhang’s trade, lost 0.4 a time after 1.6 basis points of costs, and made 1.1 (t 0.7) in the 27 auctions from mid-2011 to 2013. ZF hedged with ZN lost 0.2 a time after 2.9 of costs. The 20-year trade in ZB, hedged with ZN, holds up better: its gap of 17.7 survives without month-end days (17.0, t 2.5) and under the dependence checks (Newey-West t 2.6, bootstrap interval +2.1 to +28.0). It nets 8.2 a time (t 1.2) after 9.5 of costs on the two contracts. That’s 77 auctions, all since 2020, picked out of 18 comparisons, so it counts as an exploratory candidate for a separate test on later data, which we haven’t run here.
Lou, Yan, and Zhang’s Sharpe ratio of 1.08 came from cash notes, a bill and 10-year hedge, 10 days on each side, and 1980 to 2008. The gap between theirs and ours mixes four differences, so it doesn’t measure how much the effect has faded.
The intraday trade is short from 150 minutes before bids close, then long from the last trade before the close until three hours later, which means buying two contracts at P0. Before costs it earned 1.0 basis point of price a time in ZT (t 3.6), 2.3 in ZF (t 2.7), 2.6 in ZN around the 10-year (t 1.9), and 8.4 in UB (t 1.7). A tick on each of the two round trips costs 1.1 basis points in ZT on average (1.4 before ZT’s tick was halved in January 2019, 0.7 after), 1.3 in ZF, whose tick is 1/128 of a point, 2.5 in ZN, and 4.1 in UB.
That leaves −0.1 in ZT, +1.0 in ZF (t 1.1, interval −0.7 to +2.7), +0.1 in ZN, and +4.2 in UB (t 0.8, interval −5.7 to +14.2), and UB has lost 5.2 a time since 2020. None of these four implementations shows a reliable net return, which on its own is a good reason not to trade them, even though small positive edges in ZF and UB can’t be ruled out. All of this is before commissions, exchange fees, and any slippage at the close of bidding, when a tick is most of the expected profit.
Caveats
These are futures, which price off the cheapest bond to deliver, so a 7-year auction and a 10-year auction both land on ZN, and a weak result in futures says less about the auctioned security itself. The intraday controls match the weekday, the clock time, and the weeks around each auction, but not its position in the month, so some month-end seasonality could remain if month-end buying happens at particular hours. Other scheduled news falls inside the daily windows, payrolls and inflation figures among them. The costs assume half a tick on each side of every trade and nothing else.
Conclusion
In Treasury futures since 2010, the daily gaps around the late-month auctions coincide with the month-end rally. Days after an auction that aren’t at month-end look like any other days, and month-end days rally whether or not an auction has just happened. A trade on the month-end calendar alone did better than the auction trade, whose return beyond its month-end exposure was small and not distinguishable from zero. Whether the month-end rally is itself partly an auction effect is still open, since every month in the sample ends within a week or so of three auctions. The futures gaps are considerably smaller than the published cash estimates for 1980 to 2008, though too imprecise to say whether the original effect is still there. Intraday, the notes move against matched control days by 0.5 to 0.8 basis points of yield around the close of bidding, but none of the intraday trades we tested shows a reliable profit after a tick a round trip. The hedged 20-year trade, at 8.2 basis points a time after assumed tick costs (t 1.2) on 77 auctions, is the one result that would need a separate test on later data.
Method notes
Sample. Fiscal Data lists 1,255 nominal note and bond auctions from June 2010 to September 2026. The futures data start on 7 June 2010, and each test needs six settlements before the auction, so three auctions on 8 to 10 June 2010 are left out. So are two $25 million reopenings, a contingency test of the 10-year on 21 June 2019 (which the New York Fed paper also drops) and a 20-year on 2 December 2021, because auctions that small are unrepresentative of regular issuance. We took each auction’s maturity from the security’s own term, rounding reopenings such as “9-Year 10-Month” to the nearest standard tenor, because the service’s original-term field labels some 2-year notes as 5-year ones. Bids usually close at 13:00 New York time, or at 11:30 when two auctions share a day (63 times), and once at 10:00, for a 5-year note on Christmas Eve 2019. CME does list a 3-year note future, but it isn’t in our archive, so the 3-year auctions are matched to ZT.
Futures and costs. The continuous series are ratio-adjusted at each roll, so that a return across a roll is the front contract’s own, and they switch contracts on a fixed schedule. The one-minute bars are labelled by the minute they start. Costs are one tick per round trip on the unadjusted price of the contract actually traded that day: ZT’s tick was 1/128 of a point until January 2019 and 1/256 after, ZF’s is 1/128, ZN’s and TN’s 1/64, and ZB’s and UB’s 1/32.
Controls. Intraday control days leave out any day with a coupon auction (TIPS and floating-rate notes included), an FOMC announcement, or an early close, which leaves 3.9 control days per auction on average.
Yields and hedge ratios. To turn price moves into yields we divide by each future’s sensitivity to the matching Treasury yield in FRED, measured over the 250 trade dates up to the day before the auction. That’s 1.6 basis points of price per basis point of yield for ZT on average, 4.0 for ZF, 6.1 for ZN, and 16.7 for UB; with a single sensitivity for the whole sample instead, the full-sample swings change by at most 0.15 basis points of yield. The hedged daily trades use a beta against ZN (against ZF for the trades in ZN and TN), fixed when the trade starts, at the settlement six trade dates before the auction, and estimated from the 250 trade dates up to the day before that. Any auction without 250 earlier trade dates for every contract a calculation needs is left out of it. For the contracts whose data start in June 2010, that means auctions before mid-2011, about the first 12 of each maturity, and for TN, whose data start in January 2016, auctions before early 2017. The 20-year auctions began in 2020, so all 77 qualify.
Statistics. For the auction tests, one auction is one observation, and a t statistic is the mean divided by its standard error. The closest two auctions of one maturity are 13 trade dates apart, so their daily windows don’t overlap, but that doesn’t make them independent: neighbouring auctions can share control days, and monthly returns can be correlated. So we also calculated Newey-West t statistics with three lags, and 95% intervals from a bootstrap that resamples blocks of six consecutive auctions, which keeps each auction with its neighbours and their shared control days. For the month-end figures, one trade date is one observation, and the Newey-West versions use five lags. Across the full-sample results we report, the Newey-West t statistics differ from the ordinary ones by half a point or less. The trading conclusions are the same either way, and the one significance call that changes is UB’s intraday swing, described above.
The intervals in the tables are ordinary 95% normal intervals, and the bands in the charts are pointwise. Sharpe ratios are annualised from the return per auction by the square root of auctions per year, with the position flat in between. With seven maturities, several windows, three subperiods, and two definitions of month-end, a t statistic near 2 on its own is weak evidence.
References
- Lou, D., Yan, H., and Zhang, J. (2013), “Anticipated and Repeated Shocks in Liquid Markets”, Review of Financial Studies 26(8), 1891–1912; working-paper version, Financial Markets Group Discussion Paper 684, https://www.fmg.ac.uk/sites/default/files/publications/DP684.pdf.
- Fleming, M., Liu, W., and Nguyen, G. (2026), “Intraday Price Pressure and Order Flow Around U.S. Treasury Auctions”, Federal Reserve Bank of New York Staff Reports 1188, https://www.newyorkfed.org/research/staff_reports/sr1188.html.
- US Treasury, Fiscal Data, Treasury Securities Auctions Data, https://fiscaldata.treasury.gov/datasets/treasury-securities-auctions-data/.
- Federal Reserve Bank of St. Louis, FRED, Treasury constant maturity yields (DGS2, DGS3, DGS5, DGS7, DGS10, DGS20, and DGS30), https://fred.stlouisfed.org/.
- Board of Governors of the Federal Reserve System, FOMC meeting calendars and statements, https://www.federalreserve.gov/monetarypolicy/fomccalendars.htm.