Some clock ticks are more important than others
So, you want to exit at the close?
A lot of intraday systems try to exit near the close (sometimes simulated with the highly implausible “market on close” orders dubious backtesting platforms provide). Backtests usually fill the exit order at the last price before the clock time, give or take a tick, which assumes that one second in the last quarter-hour of the regular session is much like any other. We wanted to see whether that holds in the four CME equity index futures (NQ, ES, YM, and RTY), which seconds in that window are expensive to trade in, and when an exit order costs the least.
For all four index futures we analysed every trade, and every change to the best bid and offer, between 15:45 and 16:00 for the last 12 months (251 sessions), along with eight years of one-second bars. From those we measured how far the price moves in each second of the window, and how a market order sent at a given second actually behaves.
The short version is that most of the window is quiet, but the closing-auction timetable puts two bursts into index futures every afternoon, at 15:50:00 and 15:55:00, and both are big enough to swallow a backtest’s slippage allowance many times over. In NQ the median one-second range is 6.2 basis points at 15:50:00 and 4.3 at 15:55:00, against 0.6 for an average second in the same window, and in ES, YM, and RTY the 15:50:00 burst is 3.1 to 4.4 basis points. A simulated one-lot NQ market order sent at exactly 15:55:00 and reaching the exchange 50 milliseconds later would have filled a basis point or more (about 10 ticks) away from the earlier mid on 38% of occasions, while the same order sent a few seconds off a round time almost never would. The bursts begin within 10 to 25 milliseconds of the clock turning over, and they don’t reliably go with or against the day’s trend. The one recent exception, YM’s 15:55:00 burst going against the day’s trend in 61% of the past year’s sessions, falls to 53% over seven years. In 2018 and 2019 the bursts moved to a different second, in all four markets, in the same weeks that Nasdaq changed its closing-cross rules. Month-ends, quarterly expiries, Russell reconstitution days, and Fed afternoons make the whole close busier.
Data and method
We analysed every trade and every top-of-book change from 15:45 to 16:00 New York time on each session from 7 October 2025 to 8 October 2026. We covered NQ (E-mini Nasdaq-100, $5 a quarter-point tick), ES (E-mini S&P 500, $12.50 a quarter-point tick), YM (E-mini Dow, $5 a one-point tick), and RTY (E-mini Russell 2000, $5 a tenth-of-a-point tick). We also took trades from 12:30 to 12:45 as a midday comparison, and one-minute bars for each day’s direction. Holidays and early closes have no trading in the window, which leaves 251 full sessions out of 263 weekdays. Each session uses the outright contract with the most volume that day.
For the longer history we used the one-second bars in our archive, for about 2,186 sessions in each market from January 2018 to October 2026, again taking the most-traded outright each day. Over the 251 sessions the two sources share, the one-second bars reproduce the tick-data medians exactly in all four markets, at 15:50:00, at 15:55:00, and for a typical second. One stretch of the archive, 7 May to 3 August 2018, has the 15:50 burst landing at 15:50:01 (and the opening burst at 09:30:01) on 98–100% of days, against about 10% in the rest of 2018. We think that’s a one-second timestamp offset in those bars and not something the market did, so we left those 62 sessions out of the history.
Our measure throughout is the one-second range, the highest trade minus the lowest trade inside each clock second. We report it, and every cost, in basis points of price (hundredths of one per cent), because the four contracts’ ticks are very different sizes and NQ’s price has nearly tripled since 2020, so the count of ticks means something different in each market and each year. At the past year’s median prices (26,157 for NQ, 7,013 for ES, 49,569 for YM, and 2,709 for RTY) one basis point is about 10.5 NQ ticks, 2.8 ES ticks, 5.0 YM ticks, and 2.7 RTY ticks. For each second of the window we take the median across sessions, so one wild afternoon can’t dominate, and the ranges in brackets are 95% bootstrap intervals, resampling whole sessions.
For costs, we simulated a hypothetical one-lot market order sent at a chosen second. We add a fixed delay of between zero and 250 milliseconds to the send time and fill the order at the best bid (for a sell) or offer (for a buy) in the exchange’s top-of-book record as it stood at that moment, after every update the matching engine had stamped up to then. The order doesn’t change the book, so the model leaves out market impact, and we haven’t checked it against real fills. We measure the slippage against the mid-price just before the send time, the “price a moment earlier” that a trader watching the screen would compare it with. We count a buy and a sell every session, 502 fills per send time, since a breakout system can be exiting either way.
Two seconds stand out
In an average second between 15:45 and 16:00 the one-second range is 0.2 to 0.6 basis points, depending on the market, and only 5–15% of seconds reach one basis point, against 97–100% of sessions at 15:50:00 and at 15:55:00.
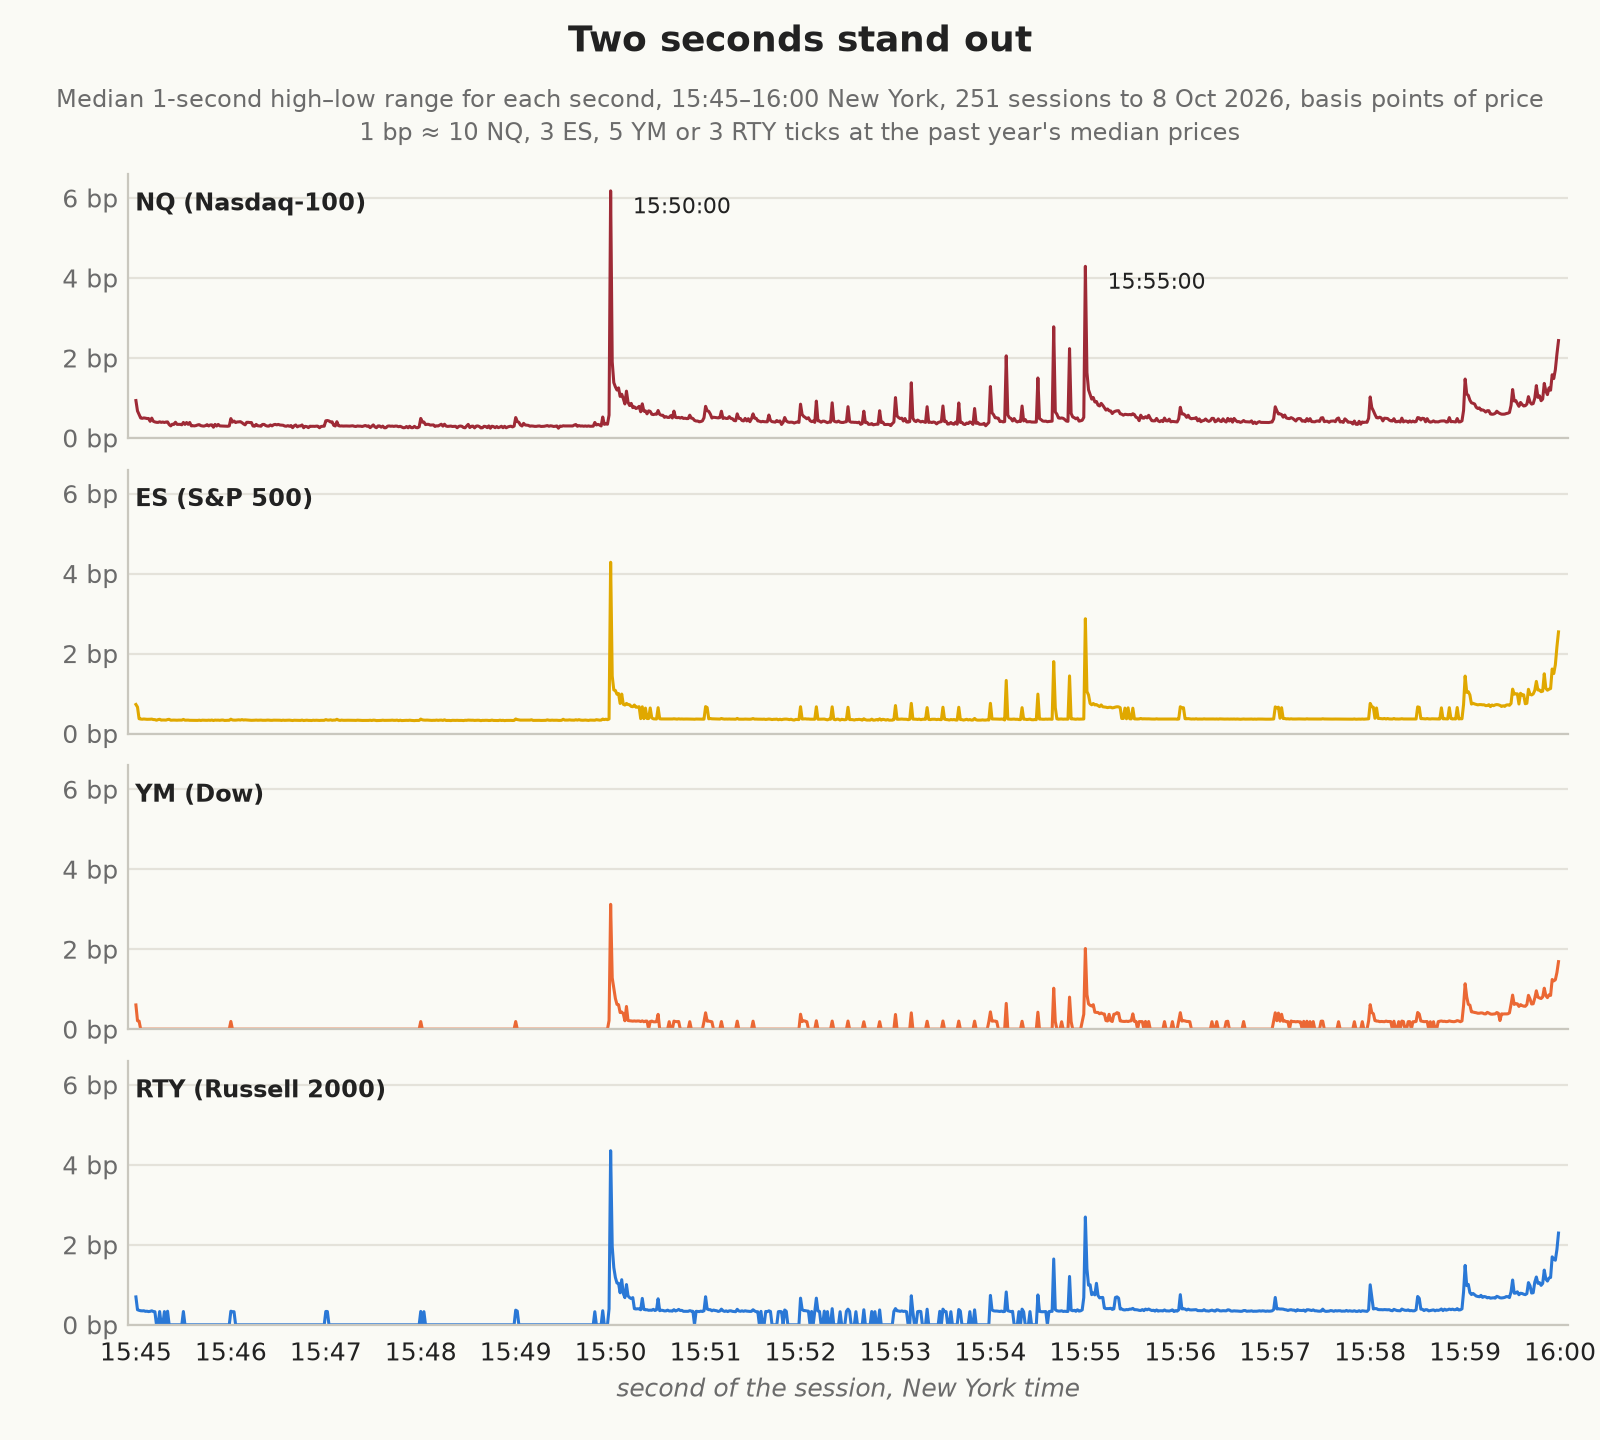
Basis points of price. At the past year’s median prices one basis point is about 10 NQ, 3 ES, 5 YM, or 3 RTY ticks.
| Market | 15:50:00 | 15:55:00 | 15:54:40 | 15:59:59 | Average second |
|---|---|---|---|---|---|
| NQ | 6.2 (5.8–6.6) | 4.3 (4.1–4.8) | 2.8 | 2.4 | 0.60 |
| ES | 4.3 (4.0–4.4) | 2.9 (2.6–2.9) | 1.8 | 2.5 | 0.50 |
| YM | 3.1 (3.0–3.4) | 2.0 (1.9–2.1) | 1.0 | 1.7 | 0.23 |
| RTY | 4.4 (4.0–4.6) | 2.7 (2.5–2.9) | 1.7 | 2.3 | 0.42 |
Median one-second range in basis points over 251 sessions, with 95% bootstrap intervals for the two bursts. The average second is the mean over every second from 15:45 to 16:00.
NQ’s bursts are the biggest, and in each market the 15:55:00 burst is about two-thirds the size of the 15:50:00 one. In ticks the gap looks much wider (67 NQ ticks at 15:50:00 against 12 in ES), because an NQ tick is about a quarter the size of an ES or RTY tick relative to price, which is probably why NQ traders notice the bursts first.
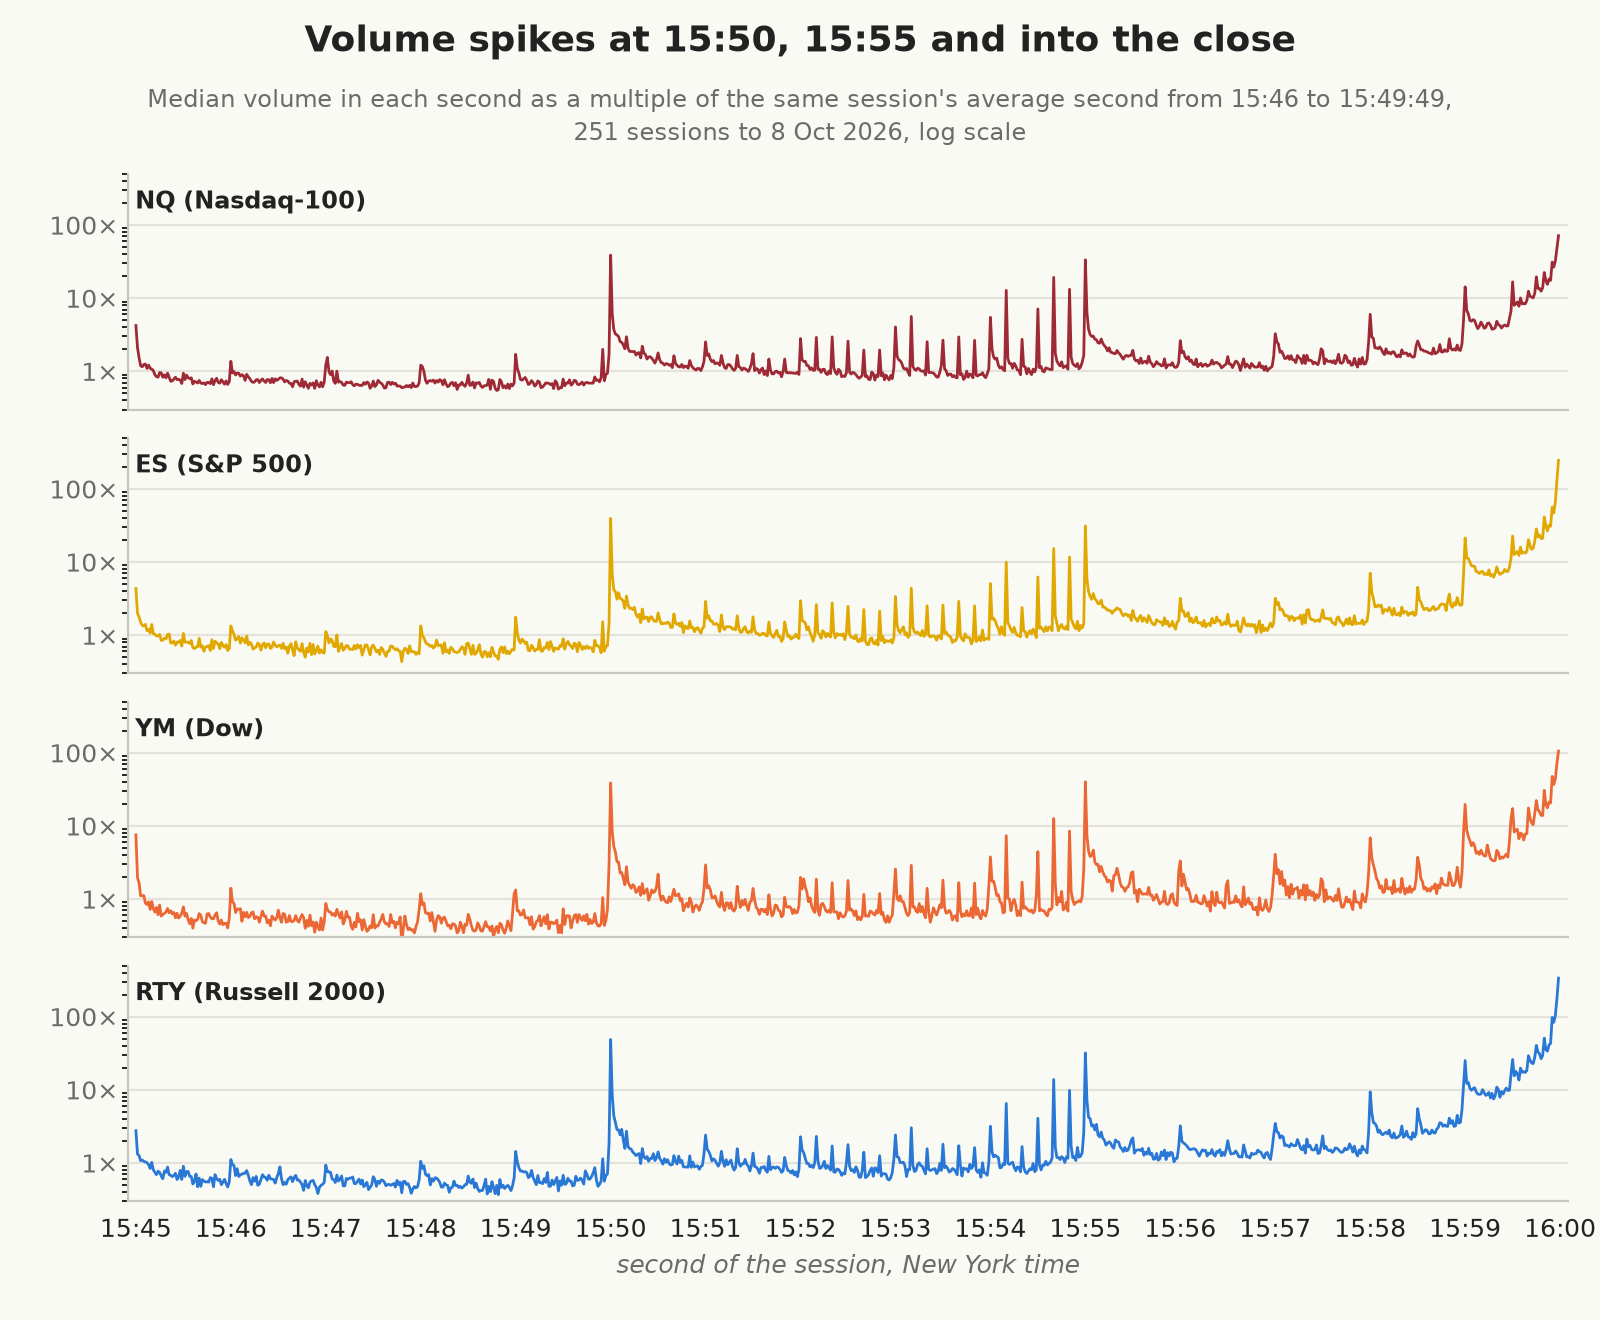
We measure volume in contracts, as a multiple of the same session’s average second from 15:46:00 to 15:49:49, counting the seconds with no trades as zero. On that measure the 15:50:00 second trades a median 39 to 49 times as much as an average quiet second and the 15:55:00 second 31 to 40 times as much, in every market. The busiest second of all, though, is the last one. 15:59:59 has a smaller price range than either burst, 1.7 to 2.5 basis points, but it trades 72 times an average quiet second in NQ, 106 times in YM, 246 times in ES, and 337 times in RTY, Whether that makes it expensive to trade in is a separate question, because more volume can come with more liquidity, and it’s the price movement, the spread, and the depth, set against the size of the order, that decide what a fill costs. The multiples for the thinner markets rest on small numbers, because the quiet average is a median 2.2 contracts a second in YM and 5.0 in RTY (against 11.5 in NQ and 39 in ES), and 37% of YM’s quiet seconds and 20% of RTY’s have no trades at all, so the range is the better comparison across markets. Across the whole window NQ prints a median 16,200 trades and 26,100 contracts, ES 24,800 trades and 115,000 contracts, RTY 6,800 trades and 18,200 contracts, and YM 3,400 trades and 5,200 contracts, between two and four times their midday counts. The final minute alone carries a third of NQ’s volume, 37% of YM’s, 46% of ES’s, and over half of RTY’s.
The bursts run on the clock
The move begins almost as soon as the second changes. Measured from the last trade before 15:55:00, NQ’s median move is 0.4 basis points after 10 milliseconds, 1.1 after 25 and 1.5 after 50, and at 15:50:00 it’s already 1.2 basis points after 10 milliseconds. At random moments in the same window, away from round times, the median move over the next 25 milliseconds is zero in all four markets. A person reading a screen couldn’t react that fast, but an algorithm reading an exchange message could. Nasdaq sends its imbalance figures out electronically on its direct data feeds, and studies of exchange message data find trading races decided in microseconds, so a move within a few milliseconds of the clock doesn’t have to come from orders placed in advance. At least three mechanisms fit what we see: orders timed for the second whatever the imbalance turns out to be, orders generated in response to the published imbalance, and market makers cancelling or repricing their quotes in anticipation of the message or in response to it. The timing ties the move to the moment the message goes out, but it can’t tell us whether the orders came before the information or after it.
The gaps between the two bursts point the same way. From 15:50:30 to 15:54:59 the seconds ending in zero have, on average, about twice the range of the seconds around them (1.9 to 2.5 times, depending on the market). Before 15:50 and after 15:55 that ratio is only 1.1 to 1.4, and at midday, from 12:30 to 12:45, it’s 1.1 to 1.2, so the rhythm belongs to the closing window and isn’t a general habit of round times. Nasdaq publishes an early imbalance figure for its closing cross every 10 seconds in exactly that window, and every second from 15:55, and the loudest of the 10-second marks are the last ones before the 15:55 cut-off. The biggest, 15:54:40, has a median range of 1.0 to 2.8 basis points depending on the market, half to two-thirds the size of the 15:55:00 burst itself.
Over the last 12 months the first second after 15:55:00 went against the day’s trend from the 09:30 open in 54% of NQ sessions, 52% of ES, 51% of RTY, and 61% of YM sessions. With about 240 sessions each, the standard error on those shares is about three percentage points, so only YM’s stands out from a coin toss. Over the nearly seven years since November 2019 the figures are 53%, 51%, 54%, and 53%, with standard errors of about 1.3 points, so the first second goes against the day slightly more often than not in NQ, YM, and RTY. These are shares of signs, so they ignore how far the price moved each way, and the day’s trend from the open is only one thing a position might be related to.
The spike moves when the exchanges move their clocks
In early 2018 Nasdaq’s cut-off for market-on-close orders, and its first imbalance publication, were both at 15:50, and NYSE’s were at 15:45. Nasdaq moved both to 15:55 on 29 October 2018. NYSE moved its cut-off and imbalance publication from 15:45 to 15:50 on 1 April 2019, and on 4 November 2019 Nasdaq added an early imbalance message at 15:50, published every 10 seconds, and stopped on-close orders being cancelled after 15:50. If the futures bursts come from the closing auctions, then they should move with those dates, and in all four markets they do.
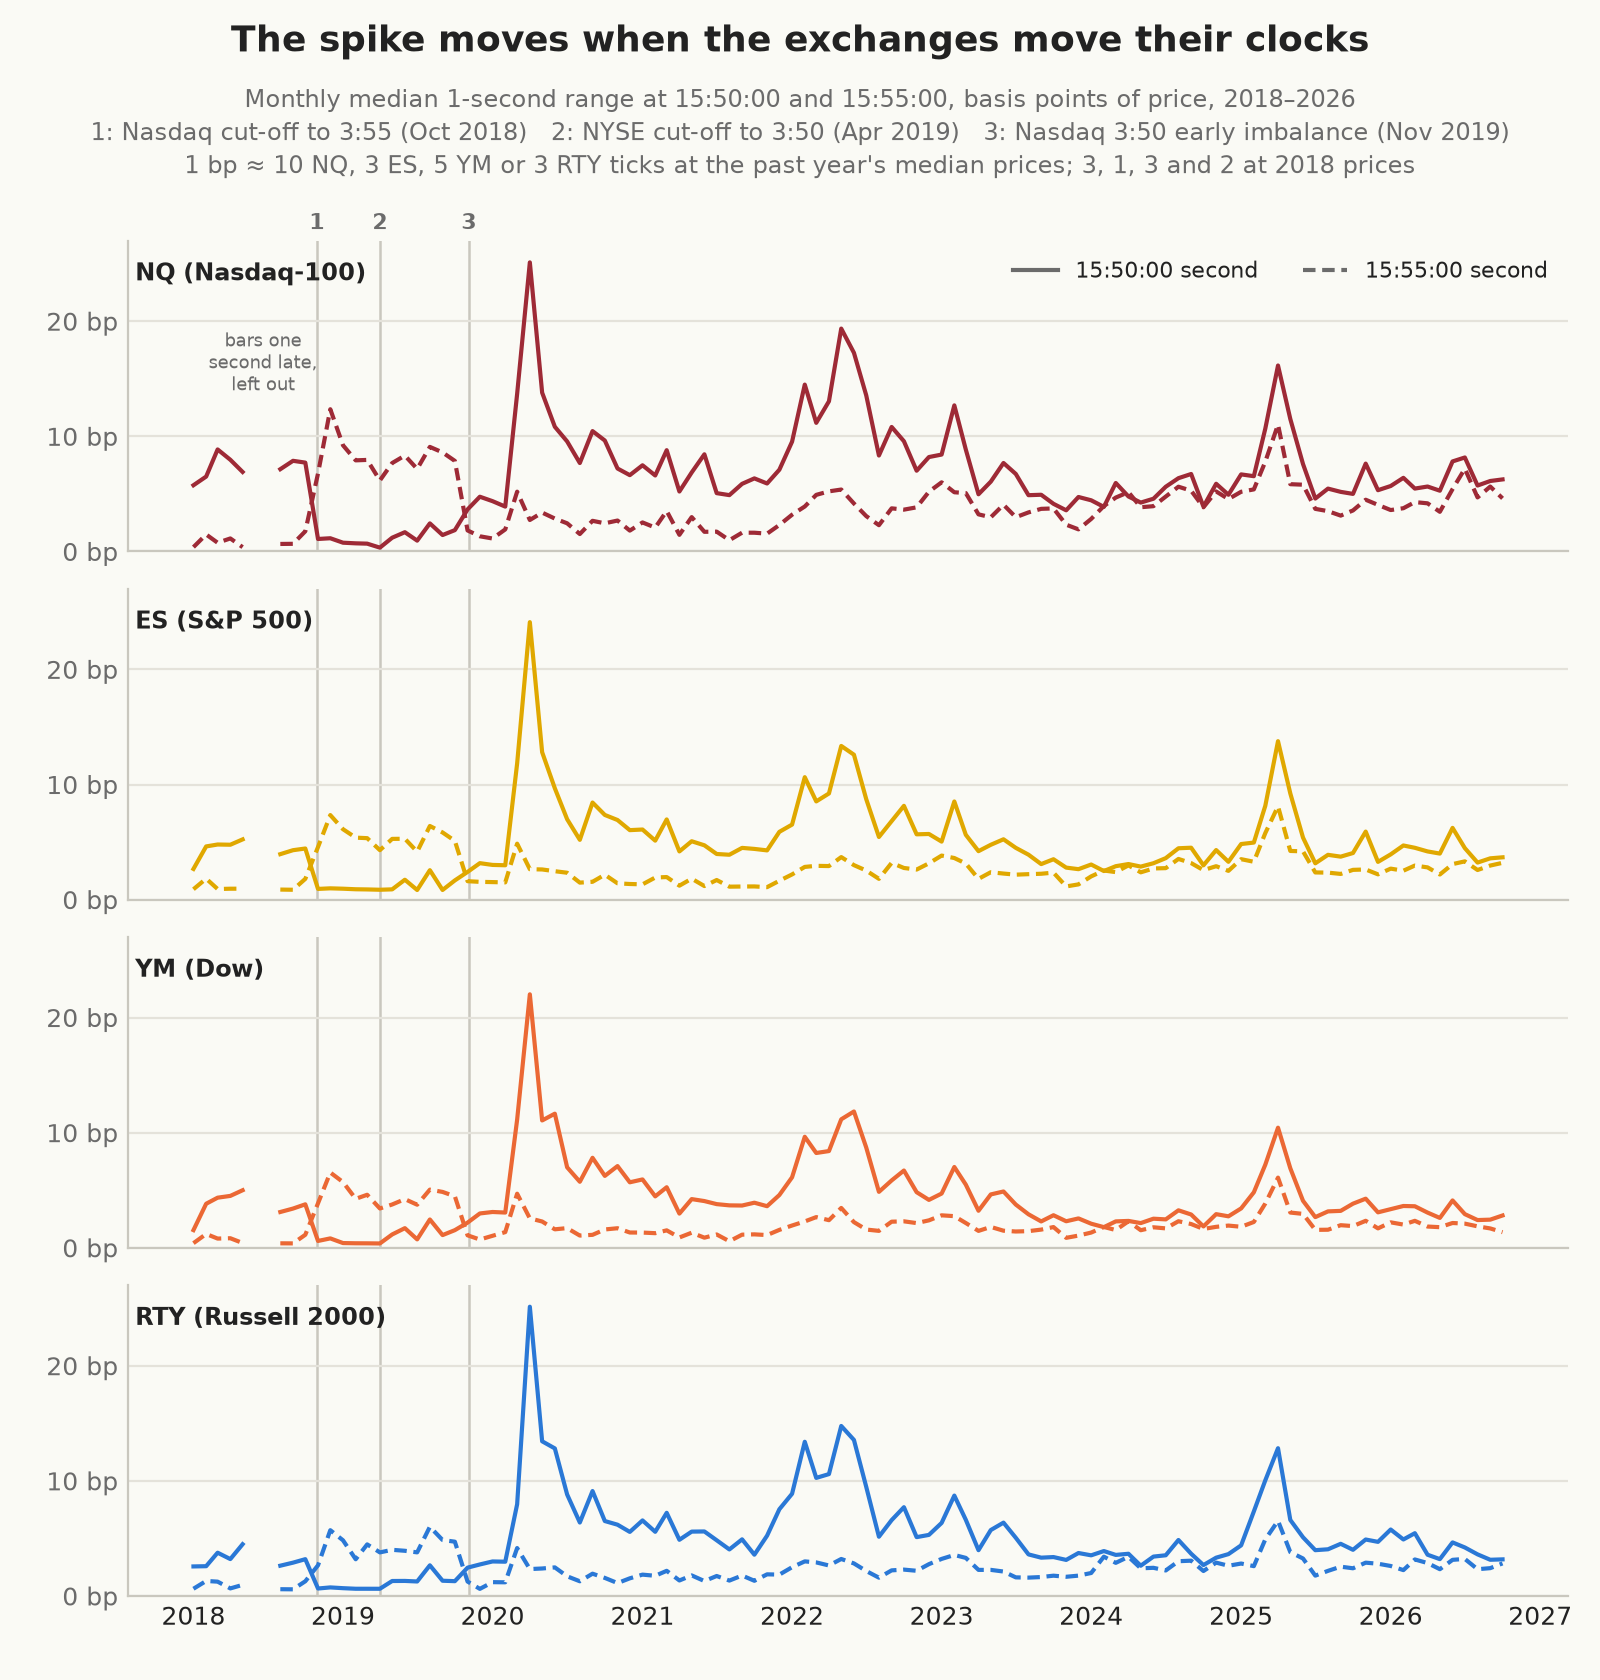
Basis points of price. One basis point is about 10 NQ, 3 ES, 5 YM, or 3 RTY ticks at the past year’s median prices, and about 3, 1, 3, and 2 at 2018 prices.
| Period | Nasdaq | NYSE | NQ | ES | YM | RTY |
|---|---|---|---|---|---|---|
| Jan–Oct 2018 | cut-off 15:50 | 15:45 | 7.6 / 0.8 | 4.4 / 0.9 | 3.5 / 0.8 | 3.0 / 0.7 |
| 29 Oct 2018 – Mar 2019 | cut-off 15:55 | 15:45 | 0.8 / 8.6 | 0.9 / 5.6 | 0.4 / 4.9 | 0.6 / 4.0 |
| Apr–Oct 2019 | cut-off 15:55 | 15:50 | 1.3 / 7.7 | 0.9 / 5.0 | 1.1 / 4.1 | 1.3 / 4.4 |
| 4 Nov 2019 – Feb 2020 | adds 15:50 early imbalance | 15:50 | 4.2 / 1.6 | 3.0 / 1.5 | 2.8 / 1.1 | 3.0 / 1.2 |
| Oct 2025 – Oct 2026 | unchanged | unchanged | 6.2 / 4.3 | 4.3 / 2.9 | 3.1 / 2.0 | 4.4 / 2.7 |
Median one-second range in basis points at 15:50:00 / 15:55:00.
In NQ the 15:50:00 second was the bigger of the two on every day of the week before 29 October 2018, and the 15:55:00 second on every day of the week after. In the week of 4 November 2019 it switched back on four days out of five. YM, whose index is about two-thirds of NYSE-listed stocks, moved with Nasdaq’s dates as cleanly as the others. Its 15:55:00 second went from 0.8 basis points before 29 October 2018 to 4.9 after it, and NYSE’s own move to 15:50 in April 2019 left YM’s 15:50:00 second at about one basis point. NYSE’s old deadline, 15:45:00, never stood out in any of the four. So index futures, the Dow included, seem to keep Nasdaq’s closing timetable rather than NYSE’s, although nothing in this data can tell us whether the trading in those seconds comes from the auctions themselves or from futures traders positioning around them.
Whether the bursts have grown depends on how they’re measured. In basis points NQ’s 15:50:00 burst was about as big in early 2018 (7.6) as it is now (6.2), and the 2020 and 2025 peaks in the chart are the COVID crash and the tariff sell-off of April 2025, when every second was bigger. A measure without a unit settles it, because it compares each burst with the same session’s own quiet seconds just before 15:50, so neither the price level nor the day’s volatility moves it. As before, volume is in contracts and the quiet average is over every second from 15:46:00 to 15:49:49, including those with no trades.
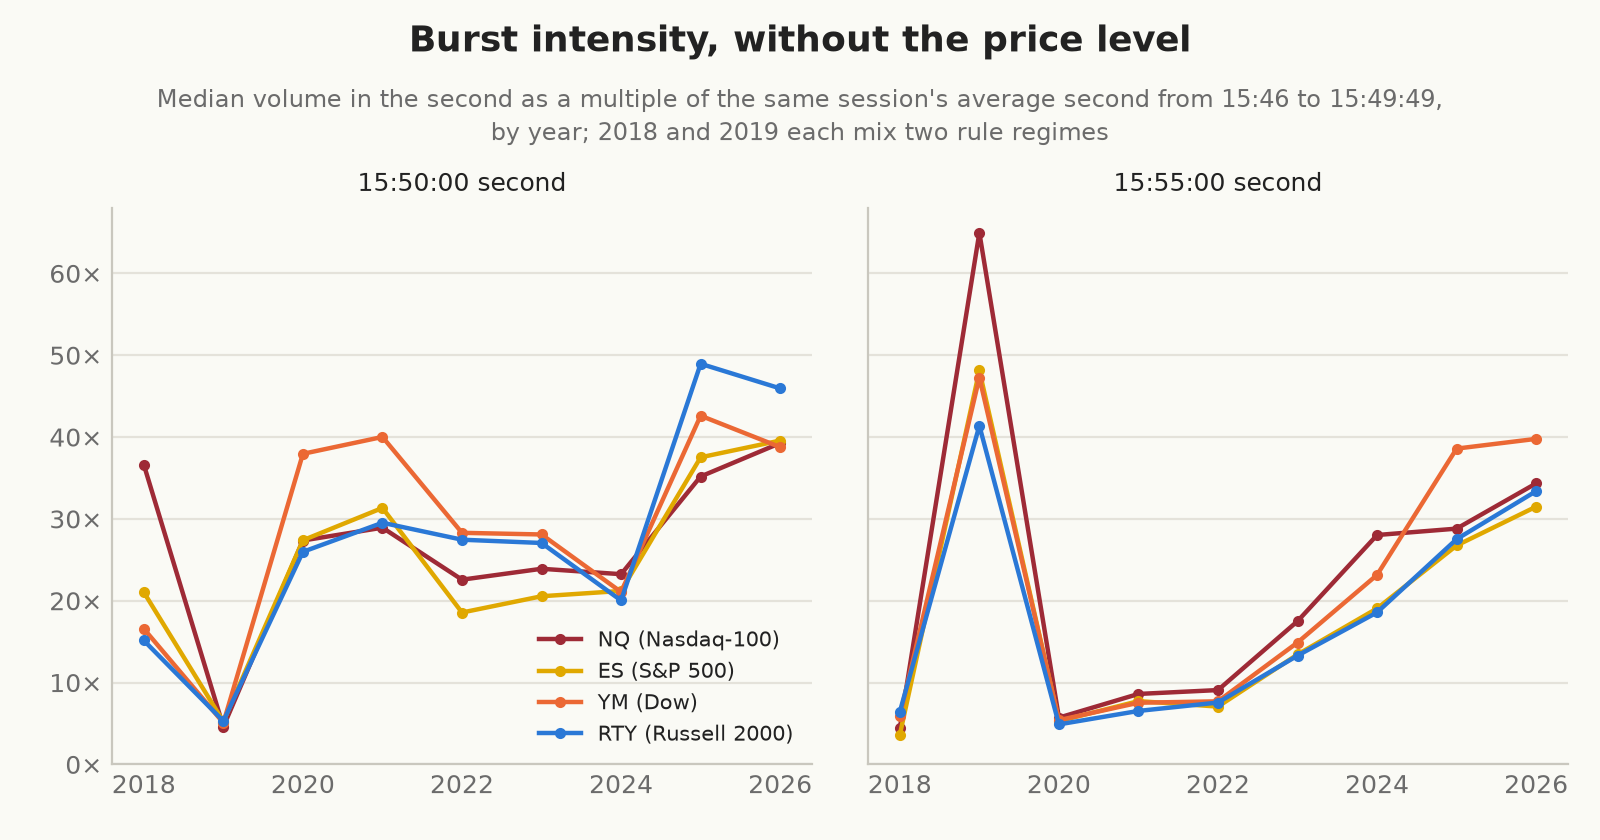
By that measure the 15:55:00 burst has grown steadily since 2020, from about five or six times the volume of an average quiet second to between 31 and 40 times in 2026, and it ranges from about 2.5 times an average second to between 9 and 18 times. The 15:50:00 burst ran at 20 to 40 times the volume of an average second from 2020 to 2024 and rose to 35 to 49 times in 2025 and 2026. (The 2018 and 2019 points each mix two rule regimes, which is why they jump about.)
What a market order costs
The number that matters for an exit is the bad tail, and at 15:55:00 it’s large. A simulated NQ order sent at exactly 15:55:00 and arriving 50 milliseconds later filled at least seven ticks (0.67 basis points, $35 a contract) from the earlier mid on 43% of the 502 fills (41–45%). It filled at least 16 ticks (1.5 basis points, $80) on 29% (26–32%), with a worst case of 68 ticks (6.1 basis points at that day’s price, $340). Speed doesn’t rescue it, because 18% of fills are already seven ticks out after 10 milliseconds and 41% after 25, and only an order that arrives before the second turns gets the price on the screen. In every market, an order sent at 15:50:00 or 15:55:00 lands a basis point or more from the mid far more often than one sent a few seconds off a round time.
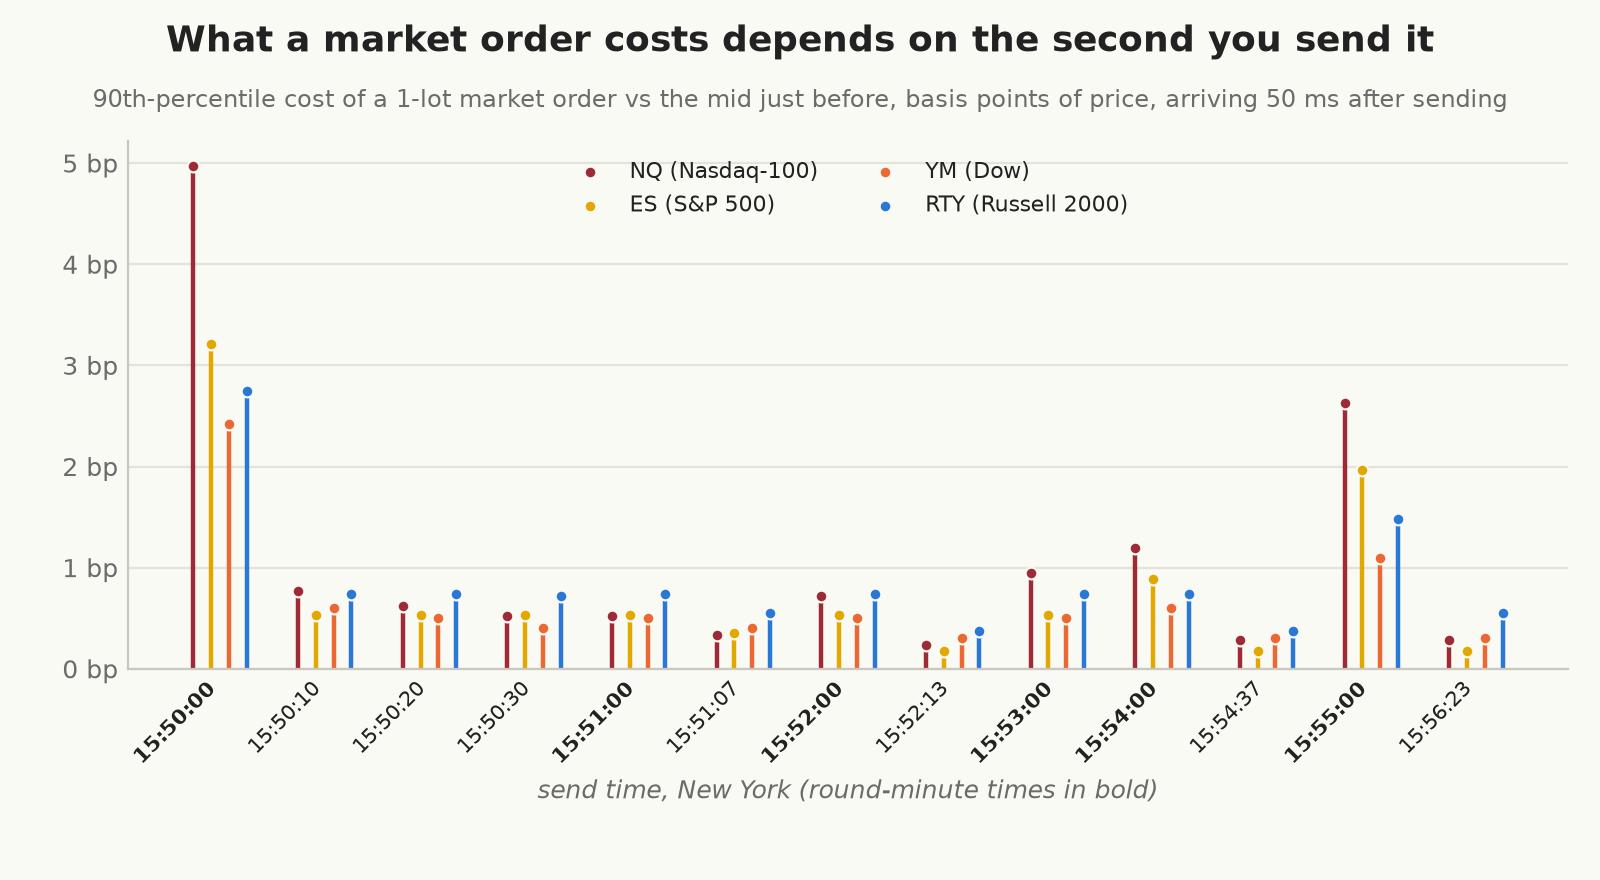
Basis points of price. At the past year’s median prices one basis point is about 10 NQ, 3 ES, 5 YM, or 3 RTY ticks.
| Send time | NQ | ES | YM | RTY |
|---|---|---|---|---|
| 15:50:00 | 4.7 (4.4–5.2) | 3.1 (2.8–3.4) | 2.4 (2.3–2.7) | 2.8 (2.5–3.0) |
| 15:55:00 | 2.5 (2.3–2.7) | 1.9 (1.6–2.0) | 1.1 (1.0–1.2) | 1.5 (1.4–1.7) |
| 15:54:00 | 1.16 | 0.91 | 0.64 | 0.81 |
| 15:53:00 | 0.93 | 0.56 | 0.54 | 0.71 |
| 15:52:00 | 0.74 | 0.56 | 0.54 | 0.72 |
| 15:51:00 | 0.50 | 0.54 | 0.49 | 0.70 |
| 15:51:07 | 0.30 | 0.38 | 0.38 | 0.55 |
| 15:52:13 | 0.25 | 0.19 | 0.32 | 0.40 |
| 15:54:37 | 0.26 | 0.19 | 0.33 | 0.43 |
| 15:56:23 | 0.26 | 0.19 | 0.32 | 0.50 |
90th-percentile cost in basis points against the mid just before sending, 502 fills at each send time arriving 50 milliseconds after sending, with 95% bootstrap intervals for the two bursts. The share of fills a basis point or more from the mid at 15:55:00 is 38% in NQ (36–41%), 25% in ES (23–28%), 13% in YM (10–15%), and 25% in RTY (22–28%); at the off-minute times it’s 0–1% in every market. The four off-minute send times illustrate the rule in the last section and were picked from this same year of data, so they aren’t recommended seconds.
The average cost is different and easily misread. Averaged over a buy and a sell, the cost is exactly half the spread on arrival, because every tick the price moves against a buyer is a tick in a seller’s favour. That average rises in the bursts only as far as the spread widens, which in NQ means from about two or three ticks (0.2 to 0.3 basis points) to about six (0.6) at 15:55:00, while ES, YM, and RTY keep their spreads close to normal even then. But the average isn’t what an exit pays, since a system is long or short and has only one side. If that side has nothing to do with which way the burst goes, then the expected cost of an exit at 15:55:00 is still only about the half-spread, and the damage is in the spread of outcomes around it. The direction figures above don’t show that this holds for any particular strategy. They compare the burst with the day’s trend, while a strategy may be long or short depending on recent returns, volatility, or order flow, any of which could be related to the way the burst goes. They also count signs and ignore sizes, so a burst that went against a position less often, but further when it did, would still cost it more on average. The only way to check is with the strategy’s own positions, comparing the burst’s move in basis points with the exit’s side on the days it traded. Where the side really is unrelated, a backtest that fills the exit at the last price before 15:55:00 books something close to the half-spread and misses both the wider spread and a large shock that averages to roughly nothing, so its average P&L is only a little optimistic while its variance, and the path its exits take, are wrong. One fixed slippage figure is also wrong in the worst place, because it’s most wrong on the days the closing flows are heaviest.
Size matters only when an order is bigger than what’s offered at the best price, because only then does it have to walk the book. In NQ that doesn’t take much, because over the last month the best bid and the best offer just before 15:55:00 each held a median of two or three contracts, with about 22 within five price levels. Sweeping that book before any burst would have cost a 20-lot about 0.2 basis points on average and a 50-lot about 0.4; additionally, a 50-lot needed more than 10 levels on a third of those days.
How long the 15:50 aftershock lasts
A system that wants to be flat before 15:55 has five minutes to work with after the first burst, so the next question is how soon after 15:50:00 the seconds go back to being quiet.
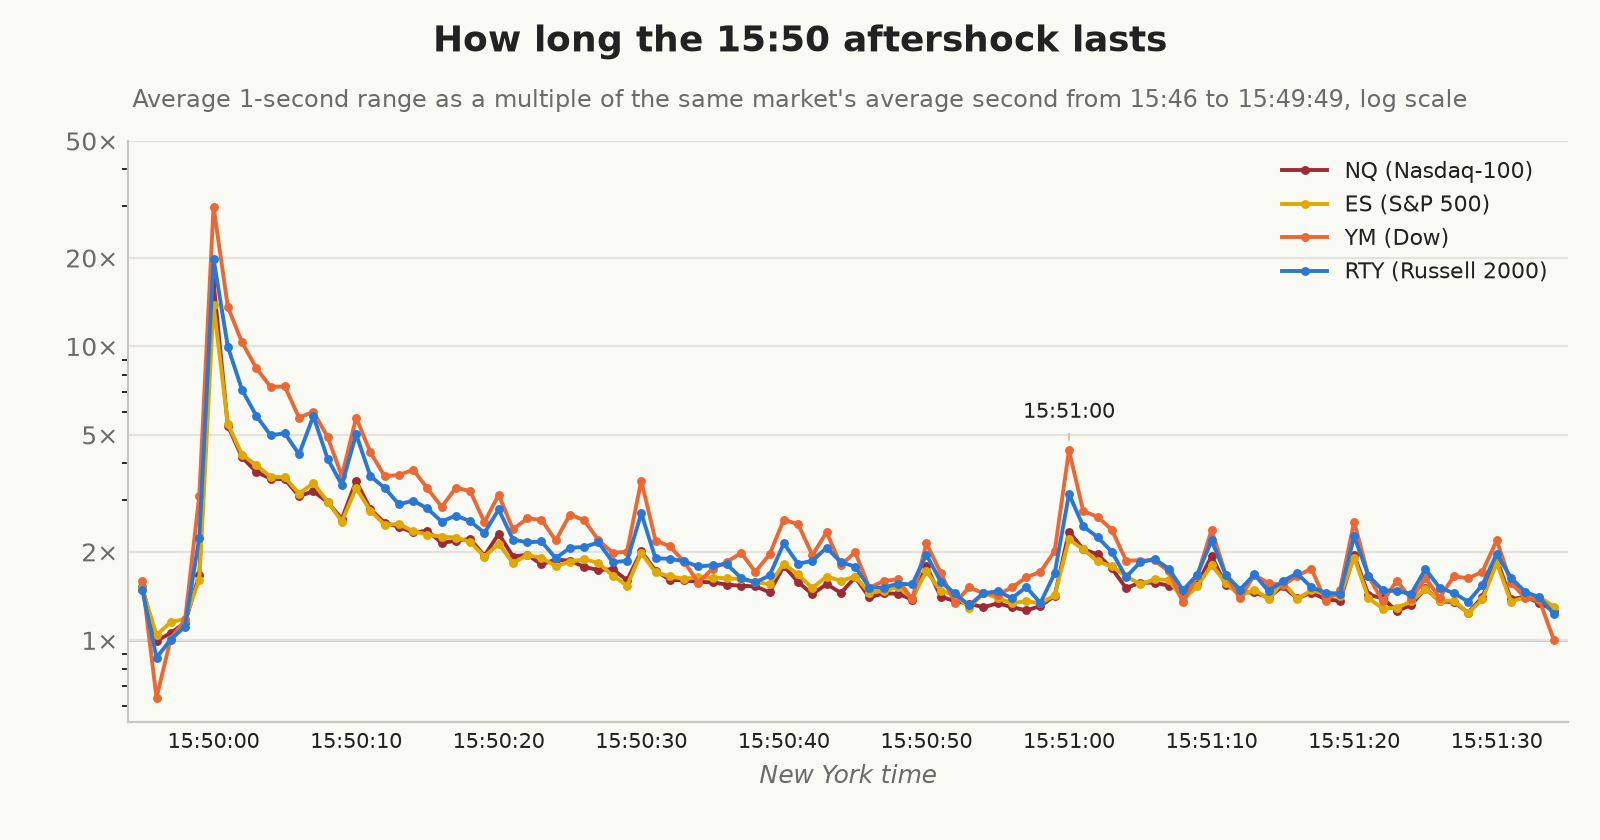
Measured against each market’s own average second from 15:46 to 15:49:49, NQ and ES decay almost identically, with RTY and YM a little slower. In NQ and ES the first second after the burst is still about five times normal, it’s down to about three times by 15:50:10 and twice by 15:50:30, and from about 15:50:50 it settles at 1.3 to 1.5 times normal, where it stays until 15:55. The 10-second marks show up as small bumps on the way down, and 15:51:00 pushes the range back up to twice normal or more.
That bump at the minute repeats, and it grows as 15:55 approaches. In NQ the median range is 0.79 basis points at 15:51:00 against 0.60 at 15:51:30, then 0.84 at 15:52:00, 1.01 at 15:53:00 and 1.29 at 15:54:00. The share of sessions reaching a basis point in the minute’s first second climbs from 37% at 15:51:00 to 41%, 52%, and 64% over the next three minutes, against 28% at 15:51:30. ES, YM, and RTY have the same rhythm, with about twice the half-minute’s range in the first second of each minute.
Are some days different?
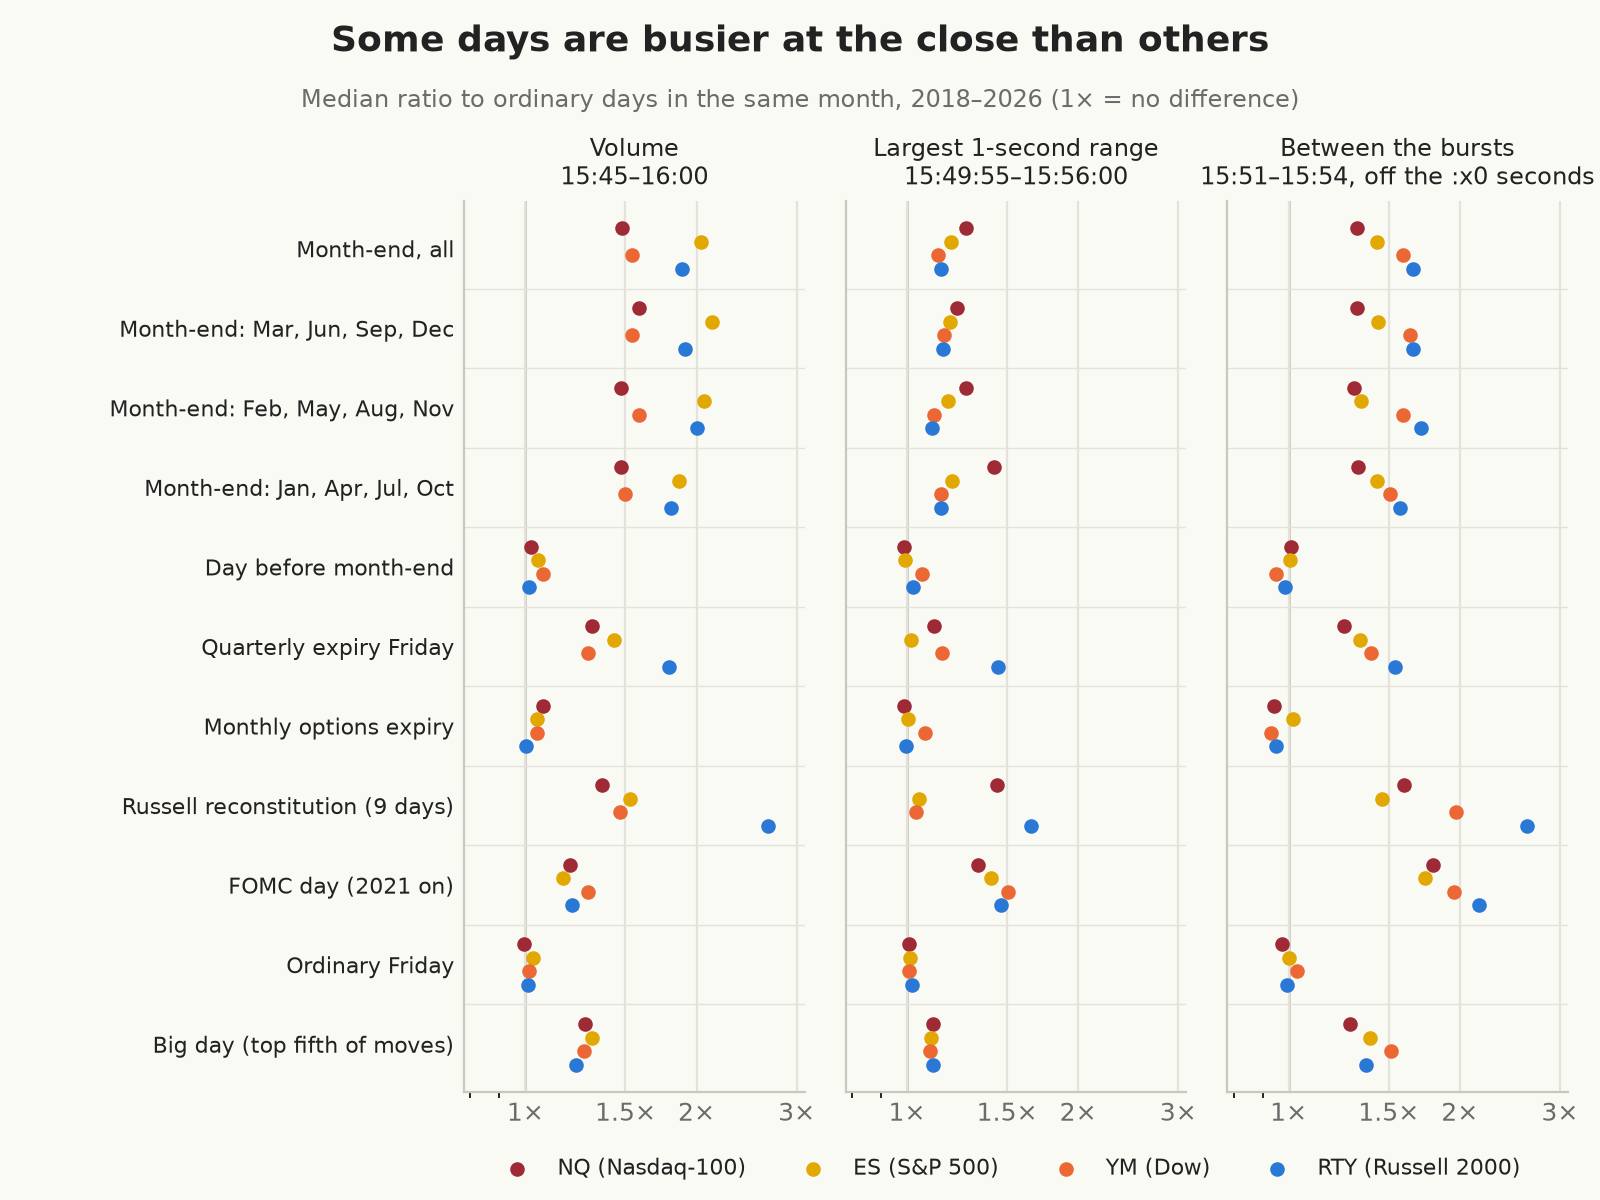
Everything so far pools all the sessions together, but the closing auctions aren’t the same size every day. Month-ends, index rebalances, and expiries send far more stock through the closing crosses, so we went back to the one-second bars and compared particular kinds of day with the ordinary days of the same calendar month, from January 2018 to October 2026. Comparing within a month stops a volatile spring or a quiet summer from passing itself off as a calendar effect. Because the burst moved from one second to another in 2018 and 2019, we used three measures that don’t depend on which second it sits in, all of them ratios with no unit. They are closing volume from 15:45 to 16:00, the largest one-second range between 15:49:55 and 15:56:00, and the average one-second range in the quiet stretch from 15:51 to 15:54 (leaving out the 10-second marks), which is where an exit moved off the round times would be sent.
Is the last day of the month different?
The last trading day of the month brings more closing volume than any other kind of day we tested, apart from Russell reconstitution days in RTY. Compared with ordinary days in the same month, volume between 15:45 and 16:00 was a median 1.5 times normal in NQ and YM, 1.9 times in RTY and twice normal in ES, with more than 90% of month-ends above their month’s ordinary level in every market. Over the last 12 months that’s about 199,000 ES contracts against 111,000 on an ordinary day. The final minute’s volume rose more than the rest, to between 1.6 and 2.5 times normal. The largest burst was 13–27% bigger, the quiet stretch between the bursts 30–65% busier, and the move from 15:45 to 16:00 1.6 to 1.8 times its usual size. Because month-ends that fall at a weekend move to the Friday, 41 of the 105 were Fridays, so we also compared each month-end with ordinary days on the same weekday in its month, and the answer barely changed (closing volume 1.45 to 1.9 times normal). The day before month-end looks like an ordinary day apart from a few percent more volume, so the effect belongs to the last day.
Does it matter which month?
It’s often said that pension and balanced funds rebalance at month-end, and most heavily at quarter-end, selling stocks into the close after a strong month and buying after a weak one. If that flow were large, quarter-ends would stand out from the other month-ends, and the closing quarter-hour would tend to go against the month-to-date move.
Quarter-ends do stand out, but only just. Closing volume at quarter-ends was 1.6 times normal in NQ and 2.1 times in ES, against 1.5 and 1.9 at the January, April, July, and October month-ends, with YM and RTY showing the same small gap, while the bursts and the quiet stretch were no bigger. The February, May, August, and November month-ends, when MSCI’s quarterly index reviews usually take effect at the close, look much like the other two groups, and with 35 month-ends in each group, differences of this size are within the noise.
Nor do month-end closes tend to go against the month. Across the four markets the move from 15:45 to 16:00 went against the month-to-date return on 47–53% of month-ends (103 or 104 in each), against 49–50% on ordinary days. The one hint is RTY at quarter-ends, where the close went against the month’s move on 24 of 35 occasions, which on its own, given how many comparisons we ran, is weak evidence.
Of course, any rebalancing that does happen may be spread through the day or the days before, which we didn’t look at since the focus of this analysis is primarily the closing window.
Are Fridays different?
Ordinary Fridays, leaving out expiries and month-ends, look the same as Mondays to Thursdays in all four markets. Closing volume and burst sizes are within a few percent, and the only difference worth mentioning is that the move from 15:45 to 16:00 is 13–21% smaller.
Are expiry Fridays different?
On the third Friday of March, June, September, and December the S&P and Nasdaq-100 index rebalances take effect at the close and quarterly index options expire, although the futures themselves settle at that morning’s open. Those closes are heavier in every market, with closing volume at 1.3 to 1.8 times normal, final-minute volume at 1.5 to 1.8 times, and the quiet stretch 25–55% busier. In NQ, ES, and YM the largest burst and the move from 15:45 to 16:00 were no bigger than usual, so the extra closing business shows up in the final minute; RTY is the exception, with a burst about 45% bigger on 80% of quarterly expiries. The monthly options expiries in the other eight months make almost no difference beyond a few percent more volume.
Does the Russell reconstitution show up in index futures?
It does in all four, and most of all in RTY, whose index is the one being rebuilt. On the nine reconstitution days since 2018, RTY’s closing volume was 2.7 times its month’s ordinary level and its final-minute volume 2.8 times, on every one of the nine, and its quiet stretch was 2.6 times as busy as usual. The other three also traded 1.4 to 1.5 times their normal closing volume on all nine days, probably because the reconstitution reshuffles the large-cap Russell 1000 as well, and NQ’s move from 15:45 to 16:00 was two to three times its usual size on every one of them. Nine days is a small sample, so these figures describe what happened on those days rather than estimate a typical reconstitution. From 2026 the Russell indexes are reconstituted twice a year, and the second date this year is 11 December.
Do Fed days carry into the close?
On the 46 FOMC statement days since 2021 the close is busier in all four markets. The largest burst was 33–51% bigger, the quiet stretch between the bursts 1.7 to 2.2 times as busy as usual on around 90% of Fed days, and the move from 15:45 to 16:00 1.7 to two times its usual size. Closing volume was up 16–29% and final-minute volume barely changed, so the extra movement comes from an afternoon still digesting the news, with few extra closing orders. These are the days when moving an exit into the quiet stretch does least to escape the extra movement.
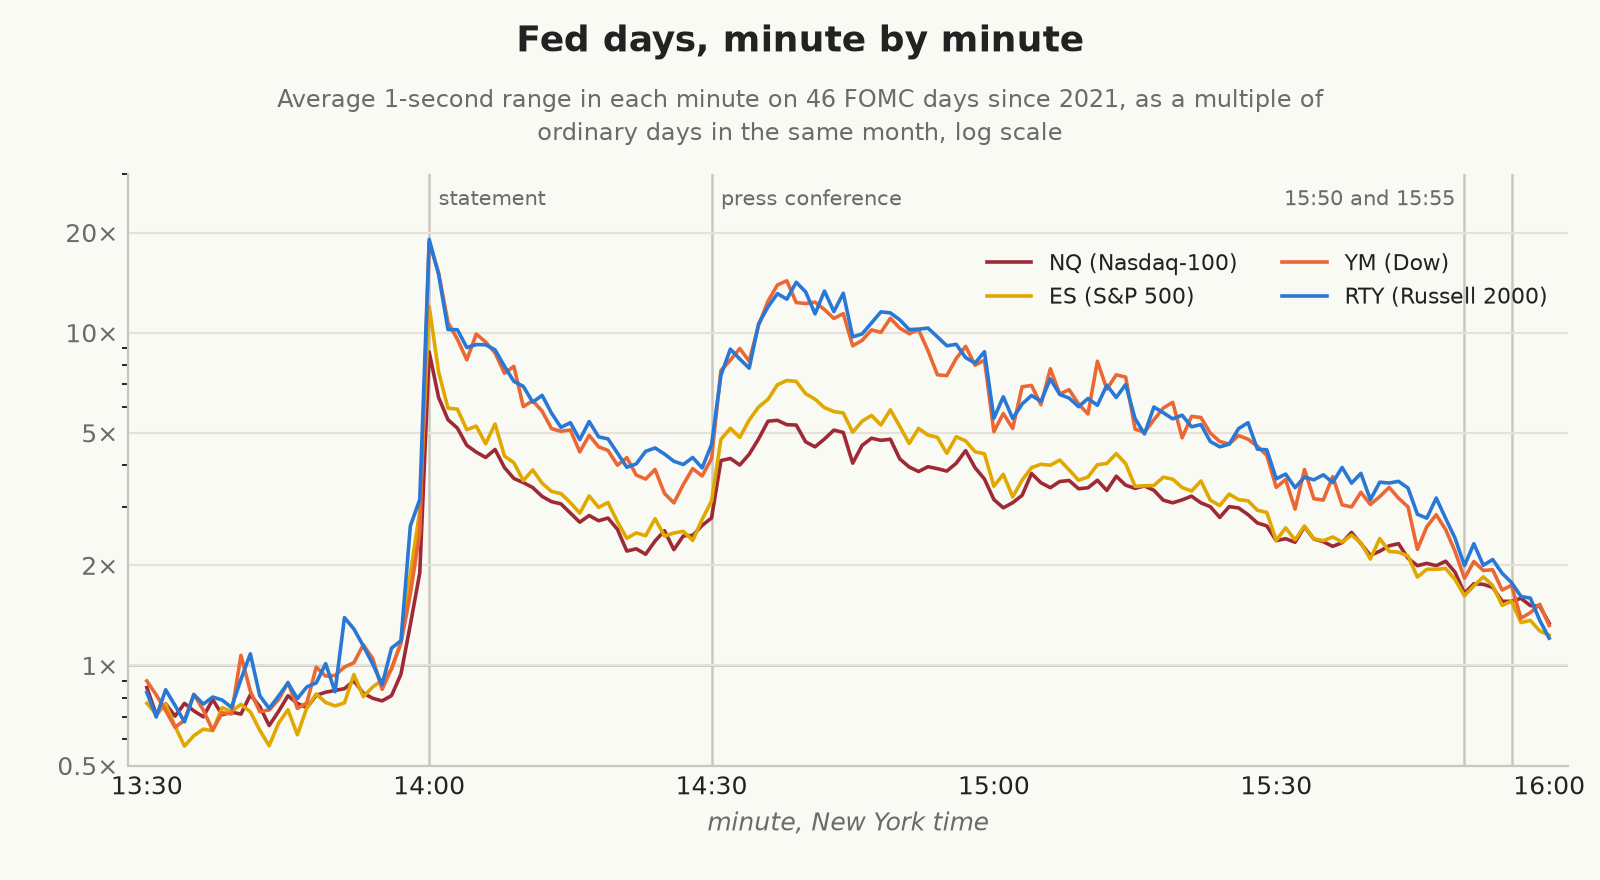
In the half-hour before the 14:00 statement the four markets are quieter than usual, at about three-quarters of their normal activity in NQ and ES and 0.8 to 0.9 in YM and RTY, until the last minute before 14:00, which is already two to three times as active as normal. The first trades after the statement land in the 14:00:00 second, and the largest one-second range comes a second later (7.3 basis points in NQ at 14:00:01). The statement minute is 9 to 19 times as active as usual, and activity halves over the next five minutes or so. The press conference, which starts at 14:30, then brings a second wave that peaks 7 to 9 minutes in, at about five to seven times normal in NQ and ES and 14 times in YM and RTY, larger than anything after the statement’s first few minutes. From there activity fades steadily, to three to five times normal at 15:00, 2.4 to 3.6 times at 15:30 and 1.6 to 2 times by 15:50, which is the extra activity the closing measures pick up.
Do big days make bigger bursts?
On the fifth of ordinary days with the biggest moves from the open to 15:45, closing volume was 23–31% above the month’s norm, the largest burst about 10% bigger, and the quiet stretch 28–51% busier. Across all ordinary days, the size of the day’s move and the size of the burst have a correlation of 0.35 to 0.42. Direction is another matter, because the closing quarter-hour went against a big day’s move on 51% of them in NQ and RTY, 54% in ES, and 57% in YM, so a big day predicts a busier close without saying much about which way it will go.
What else could be worth testing?
Several other days could plausibly change the close, and we haven’t tested them yet. The December quarterly expiry, when the Nasdaq-100’s annual reconstitution coincides with the S&P rebalance, may differ from the other three, though there have only been eight of them since 2018. Days when a very large company joins the S&P 500 (Tesla’s addition took effect at the close on 18 December 2020, itself a quarterly expiry) are obvious candidates, and so is the Russell’s new December reconstitution. So are the first trading day of the month, the sessions either side of US holidays, and the days of CPI and jobs reports, which would show whether a big morning carries through to the close.
What this means for an exit near the close
Every cost in this post is measured against the mid just before that order was sent. That measures how well an order executes at its own moment, and on that measure the seconds to stay away from are 15:50:00 and its aftershock, the top of every minute, the 10-second marks between 15:52 and 15:55 (above all 15:54:10, 15:54:40, and 15:54:50) and 15:55:00 itself. That suggests a rule worth testing: send the exit a few seconds off the minute and off the 10-second marks, not in the first 30 seconds after 15:50, and with a small random offset so the order doesn’t become part of a new crowd if others make the same change. The times we happened to test, such as 15:51:07, 15:52:13, and 15:54:37, are illustrations of that rule rather than recommendations. They were picked from the same year of data they’re used to describe, so they won’t necessarily be the cheapest seconds in another year, although any second that follows the rule should land among the cheap ones by this measure.
The last few seconds before 16:00 are less clear. 15:59:59 is the busiest second of the session and its range, 1.7 to 2.5 basis points, is several times an average second’s, but the extra volume may come with extra liquidity, and we haven’t simulated fills there or measured the depth, so we can’t say whether it’s an expensive second for a given order size.
None of this identifies the best exit policy, because resetting the benchmark to each order’s own send time leaves out what happens to the position while it waits. An exit sent before a burst and one sent after it are exposed to different stretches of the market, and an exit at 15:55:05 can show almost no slippage against its own mid while having lost a lot in the burst it sat through. Comparing policies properly needs the same starting position and one benchmark price, taken when the decision to exit is made, for every policy. It needs the total P&L through to the last fill, so that both the execution cost and the risk of waiting are counted, and an objective set in advance, whether that’s average return, the size of the worst losses, how closely live results track the backtest, or a mix of them. We haven’t done that. The rule above is a reasonable hypothesis for making execution less uncertain, and we haven’t shown that it improves any particular strategy’s results.
On month-ends, quarterly expiry Fridays, Russell days, and Fed days the whole window is busier, the quiet stretch included (by a third to two-thirds on month-ends and by 70% to more than double on Fed days), so moving the exit away from the bursts does less on those days.
Caveats
The costs are hypothetical one-contract executions against the reconstructed best quote, without market impact. Because the book is rebuilt from the exchange’s own timestamps, liquidity that earlier orders took before our order arrived is already gone from it. Real fills can still differ from the simulation: latency varies from order to order and may stretch in the bursts, updates stamped at the same instant leave the order’s place in the queue of events unresolved (we put it after them), and a real order can move the book and the orders of other traders. None of that makes every real fill, or every percentile, worse than the simulation, and we haven’t compared our figures with actual fills, which is what it would take to show a systematic execution penalty. We also had only one month of order-book depth, and only for NQ, so the size estimates rest on 23 sessions. The direction figures are shares of signs measured against the day’s trend from the open, so they can’t show that a given strategy’s exit side is unrelated to the burst, and the expected cost of a real exit could be above the half-spread even where those shares are close to 50%.
The calendar comparisons test 11 kinds of day on six measures in four markets, so a few modest p-values among them are bound to be chance. The month-end, quarterly expiry, and Fed-day results are far stronger than that, with 70–100% of those days above their month’s norm on the main measures, while the Russell figures rest on nine days and the Fed days only go back to 2021. YM’s and RTY’s quiet seconds often don’t trade at all, so some of their ratios are coarse.
The link to the closing auctions is an inference from timing. The dates line up with Nasdaq’s rule changes to the week, and Nasdaq’s 10-second publication schedule matches the 10-second rhythm between the bursts, which connects the bursts to the auction timetable. It doesn’t show what moves the price in those milliseconds, whether orders scheduled in advance, orders reacting to the published imbalance, or quotes being pulled and repriced around it. Separating those needs the imbalance messages and the futures messages on synchronised timestamps, and we haven’t read the imbalance feeds at all. The Fed-day profile is an average over 46 meetings with very different news. The history before October 2025 comes from one-second bars, which can’t see inside a second, and leaves out the 62 summer sessions of 2018 whose timestamps look a second late.
What’s left
If we wanted to take this further, a possible next step is to analyse the exchanges’ own closing-imbalance feeds. Even a month of them would be the direct test of whether the size of each day’s published imbalance predicts the size, or the direction, of the burst that follows it, and of whether YM’s tendency to go against the day comes from imbalances that tend to fade the trend. With the imbalance and futures messages on synchronised timestamps, they would also show whether futures orders and quote changes arrive before each message or after it, which is the only way to tell orders scheduled in advance from orders reacting to the published figure. Index futures outside the US are another test, because the Nikkei and DAX futures follow cash markets that run their own closing auctions on their own timetables. If their bursts follow those timetables, then the effect is about closing auctions in general rather than anything peculiar to Nasdaq. The test that matters most for traders is the policy comparison described above: a real strategy’s positions, exited by each candidate policy from the same decision-time benchmark, with total P&L through liquidation, checked against that strategy’s actual fills.
Conclusion
A daily bar keeps one closing price, and a backtest built on daily bars books every exit at that price as if someone could have traded there. But everything we’ve described happens inside that bar. NQ’s range in the 15:50:00 and 15:55:00 seconds is a median 6.2 and 4.3 basis points, against 0.6 for an average second, and between the two bursts the market pulses every 10 seconds in time with Nasdaq’s imbalance messages. Month-ends and Fed afternoons make the whole quarter-hour busier, and in 2018 and 2019 the bursts moved to a different second when Nasdaq changed its rules. A daily open, high, low, and close shows none of it, so the idea that daily bars are good enough for anyone exiting near the close is a fallacy: the bar has already thrown away the seconds in which the exit is filled.
One-minute bars aren’t much better, because the 15:55:00 burst and the quiet seconds just after it fall in the same bar. We needed every trade and every quote change, timestamped to the nanosecond, to see the problem at all, and putting a price on it for a real strategy will take that strategy’s own positions and fills. In Peering into daily bars we showed that many short-term trading rules need facts the daily bar throws away, and an exit near the close is one more of them. Until someone runs that test, a daily-bar backtest’s exit near the close is a guess about some of the most crowded seconds of the day, and the bar can’t tell you how far off it was.
Despite all of this, we expect that many traders will continue to rely on daily bars. And we’ll happily trade against them.
References
- Nasdaq, TotalView-ITCH 5.0 specification, section 1.6, “Net Order Imbalance Indicator (NOII) Message”, https://www.nasdaqtrader.com/content/technicalsupport/specifications/dataproducts/NQTVITCHspecification.pdf.
- Matteo Aquilina, Eric Budish, and Peter O’Neill, “Quantifying the High-Frequency Trading ‘Arms Race’”, Quarterly Journal of Economics 137(1), 2022, 493–564, https://doi.org/10.1093/qje/qjab032.
- Nasdaq, Equity Trader Alert 2018-82, “Nasdaq to Implement Closing Cross and NOII Changes on October 29, 2018”, https://www.nasdaqtrader.com/TraderNews.aspx?id=ETA2018-82.
- Nasdaq, SR-NASDAQ-2019-010, Early Order Imbalance Indicator, https://listingcenter.nasdaq.com/assets/rulebook/nasdaq/filings/SR-NASDAQ-2019-010.pdf.
- SEC Release 34-87198, approving SR-NASDAQ-2019-064 (2 October 2019), https://www.sec.gov/files/rules/sro/nasdaq/2019/34-87198.pdf.
- Nasdaq, Equity Trader Alert 2019-66, “Reminder: Nasdaq Closing Auction Enhancements” (effective 4 November 2019), https://www.nasdaqtrader.com/TraderNews.aspx?id=ETA2019-66.
- NYSE, “Market on Close/Limit on Close Cutoff Time Change” (1 April 2019), https://www.nyse.com/publicdocs/nyse/markets/nyse/NYSE_MOC_LOC_Cutoff_Time_Change_Go_Live.pdf.
- SEC Release 34-85021, approving the NYSE Rule 123C change, https://www.sec.gov/files/rules/sro/nyse/2019/34-85021.pdf.
- Federal Reserve, FOMC meeting calendars, https://www.federalreserve.gov/monetarypolicy/fomccalendars.htm.
- FTSE Russell, Russell reconstitution, https://www.lseg.com/en/ftse-russell/russell-reconstitution, and “Russell US Indexes move to semi-annual reconstitution” (17 December 2025), https://lseg.com/en/ftse-russell/research/russell-us-indexes-move-to-semi-annual-reconstitution.
Method note: NQ, ES, YM, and RTY, each session’s most-traded outright, 251 sessions from 7 October 2025 to 8 October 2026 from our tick data, and about 2,124 sessions in each market from January 2018 from one-second bars. The one-second range is the high minus the low of all trades in a clock second, reported in basis points of each session’s price, with 95% intervals from a session bootstrap. Costs are hypothetical one-lot market orders filled at the reconstructed best quote on arrival, without market impact, measured against the mid before sending, buys and sells pooled. The calendar comparisons use all the one-second sessions from January 2018, each special day against the median of ordinary days in the same month, with sign tests on the share of special days above that median. The Fed-day profile compares each minute from 13:30 to 16:00 on 46 FOMC days with the same minute on ordinary days in the same month. Every request was priced before download and none was charged.