The importance of some clock ticks late in the day (QQQ and SPY)
So, you want to exit an index ETF near the close?
In The importance of some clock ticks late in the day (index futures) we found that the four CME equity index futures jump at 15:50:00 and 15:55:00 every afternoon, in time with Nasdaq’s closing-auction messages, and that a market order sent in either second is far more expensive than one sent a few seconds later. Plenty of traders hold the same exposure through the two big index ETFs instead, QQQ for the Nasdaq-100 and SPY for the S&P 500, so we asked the same questions of them. Do the ETFs jump in the same seconds, what does a market order cost, and what happens after 16:00, when the stock market has closed but the futures and the options on both ETFs are still trading?
The answer to the first question is yes, and almost exactly. Over the past year QQQ’s median one-second range is 5.6 basis points at 15:50:00 and 4.1 at 15:55:00, against 6.2 and 4.3 for NQ, and SPY’s is 3.7 and 2.6, against 4.2 and 2.9 for ES. In both bursts the ETF and its future move the same way on 96% to 100% of days, depending on the ETF and the second, with a correlation of 0.99 between the two moves. That holds for SPY even though SPY’s own closing auction runs on NYSE Arca, whose timetable has nothing at 15:50 or 15:55, and when Nasdaq moved its own cut-offs in 2018 and 2019 the SPY bursts moved with them. Where they differ is at the close itself and after it. QQQ has a closing auction on Nasdaq that sets its official close, the price a daily bar records, and an order can actually trade there, which isn’t true of the futures. After 16:00 the ETFs’ trading on Nasdaq nearly stops and their spread widens several times over, although their quotes go on moving with the futures. And halfway through the year a fee came back that widened the ETFs’ spreads across the market, doubling QQQ’s.
Data and method
Most of the ETF data is Nasdaq’s own feed (TotalView-ITCH), which carries every trade that happens on Nasdaq and Nasdaq’s own order book, but nothing from the other exchanges or from off-exchange venues. The volume figures are therefore Nasdaq’s share of each ETF’s trading, a second with no Nasdaq trade counts as having no range even if the ETF traded elsewhere, and the high and low of a second come only from Nasdaq prints. The futures trade on one exchange, so their data is complete. We used one-second bars for QQQ and SPY from 1 May 2018, when the feed’s history starts, to 14 October 2026, 2,108 full sessions, alongside the one-second NQ and ES bars from the futures post on the same days (each day’s most-traded outright). For the past year (249 sessions from 15 October 2025 to 14 October 2026, leaving out holidays and early closes) we also took every Nasdaq trade and every change to Nasdaq’s best bid and offer for both ETFs from 15:45 to 16:15. We also took Nasdaq’s record of each day’s official opening and closing prints. TotalView carries Nasdaq’s whole displayed book, but we downloaded only the top of it.
To compare the ETFs’ quotes with the futures’ after the bell, we also went beyond Nasdaq and took CME’s best bid and offer for ES and NQ once a second (the front contract by volume). And to see whether a change in Nasdaq’s spread was Nasdaq’s alone, we took each ETF’s best bid and offer once a minute from the seven largest lit exchanges (Nasdaq, NYSE Arca, NYSE, Cboe BZX, Cboe EDGX, IEX, and MEMX), along with each day’s consolidated volume. The best bid across those seven, set against the best offer, is close to the national best bid and offer but not identical to it, since a few small exchanges are missing. The trade and burst figures use each exchange’s own timestamps, and where we line up Nasdaq’s quotes against CME’s, both are sampled on the clock of the data provider (Databento) that captured them, which is synchronised across its sites.
The measures are the ones from the futures post: the one-second range is the highest trade minus the lowest inside each clock second, in basis points of price, and for each second we take the median across sessions, with 95% bootstrap intervals in brackets, resampling whole sessions. At the past year’s median prices ($643.52 for QQQ and $703.92 for SPY) one basis point is about 6.4 cents of QQQ and 7.0 cents of SPY, so the one-cent tick is about 0.16 and 0.14 basis points. Volume is in shares, as a multiple of the same session’s average second from 15:46:00 to 15:49:49, counting seconds with no trades as zero.
For costs we simulated a market order sent at a chosen second, which reaches Nasdaq 50 milliseconds later and fills at Nasdaq’s best bid (for a sell) or offer (for a buy) as it stands at that moment. The cost is the price slippage against Nasdaq’s mid just before the send time, signed so that a positive figure is worse for the order, and it leaves out commissions and fees (we come back to the one fee that matters here). We count a buy and a sell every session, so the 249 sessions give 498 fills at each send time, and the bootstrap resamples sessions with both fills together. That’s an order routed to Nasdaq alone, and a broker’s router could do better by finding a price on another exchange or hidden orders that don’t show in the book, so the figures describe only Nasdaq’s displayed liquidity.
The same two seconds
In an average second between 15:45 and 16:00 QQQ’s range is 0.43 basis points and SPY’s 0.35, and only 10% and 7% of seconds reach one basis point, against 98% to 100% of sessions at 15:50:00 and 15:55:00, depending on the ETF and the second.
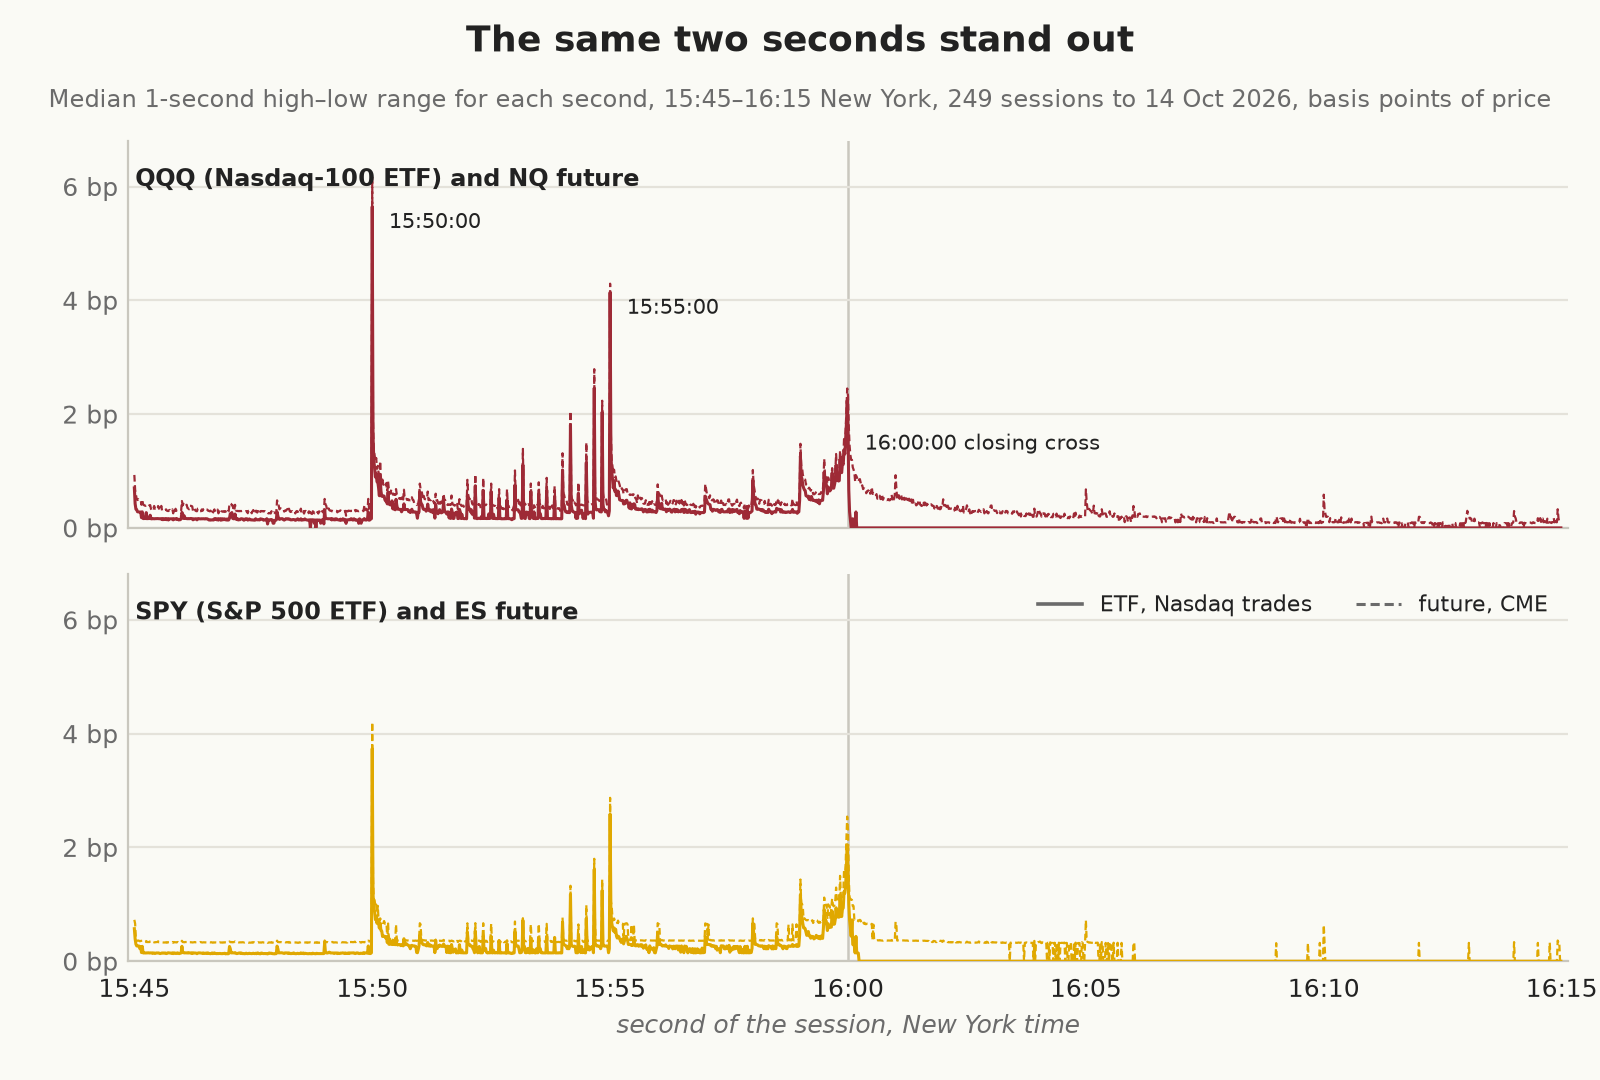
Basis points of price. At the past year’s median prices one basis point is about 6.4 cents of QQQ and 7.0 cents of SPY.
| 15:50:00 | 15:55:00 | 15:54:40 | 15:59:59 | 16:00:00 | Average second | |
|---|---|---|---|---|---|---|
| QQQ | 5.6 (5.3–6.0) | 4.1 (3.9–4.5) | 2.5 | 2.2 | 1.8 | 0.43 |
| NQ | 6.2 (5.8–6.6) | 4.3 (4.1–4.6) | 2.8 | 2.5 | 2.3 | 0.59 |
| SPY | 3.7 (3.4–3.9) | 2.6 (2.4–2.8) | 1.6 | 2.1 | 1.6 | 0.35 |
| ES | 4.2 (3.9–4.4) | 2.9 (2.6–2.9) | 1.8 | 2.5 | 2.3 | 0.50 |
Median one-second range in basis points over 249 sessions to 14 October 2026, with 95% bootstrap intervals for the two bursts. The average second is the mean of the range over every session and every second from 15:45:00 to 15:59:59, with seconds that have no Nasdaq trade counted as zero. QQQ’s 16:00:00 second includes Nasdaq’s closing cross.
The ETFs’ bursts are slightly smaller than the futures’, at a median 93% and 95% of the future’s range in the same second for QQQ (at 15:50:00 and 15:55:00) and 88% and 94% for SPY, which is about what we’d expect from seeing only Nasdaq’s prints, and they’re plainly the same bursts. Across the 249 sessions the ETF’s move in the burst second has a correlation of 0.99 with its future’s in both bursts, and the two moved the same way on 97% (15:50:00) and 96% (15:55:00) of days for QQQ and NQ, and 100% and 99% for SPY and ES. The days with a big burst in the future are the days with a big burst in the ETF, with correlations of 0.92 to 0.98 between the sizes of the ranges, although at one-second resolution we can’t tell which of the two moves first.
The ETFs also have the futures’ 10-second rhythm between the bursts. From 15:50:30 to 15:54:59 the seconds ending in zero have 2.7 times the average range of the seconds around them in QQQ and 2.2 times in SPY, against 1.2 to 1.3 before 15:50 and after 15:55, and 1.15 to 1.17 at midday, from 12:30 to 12:45. Those are the 10-second marks at which Nasdaq publishes its early imbalance figure for the closing cross.
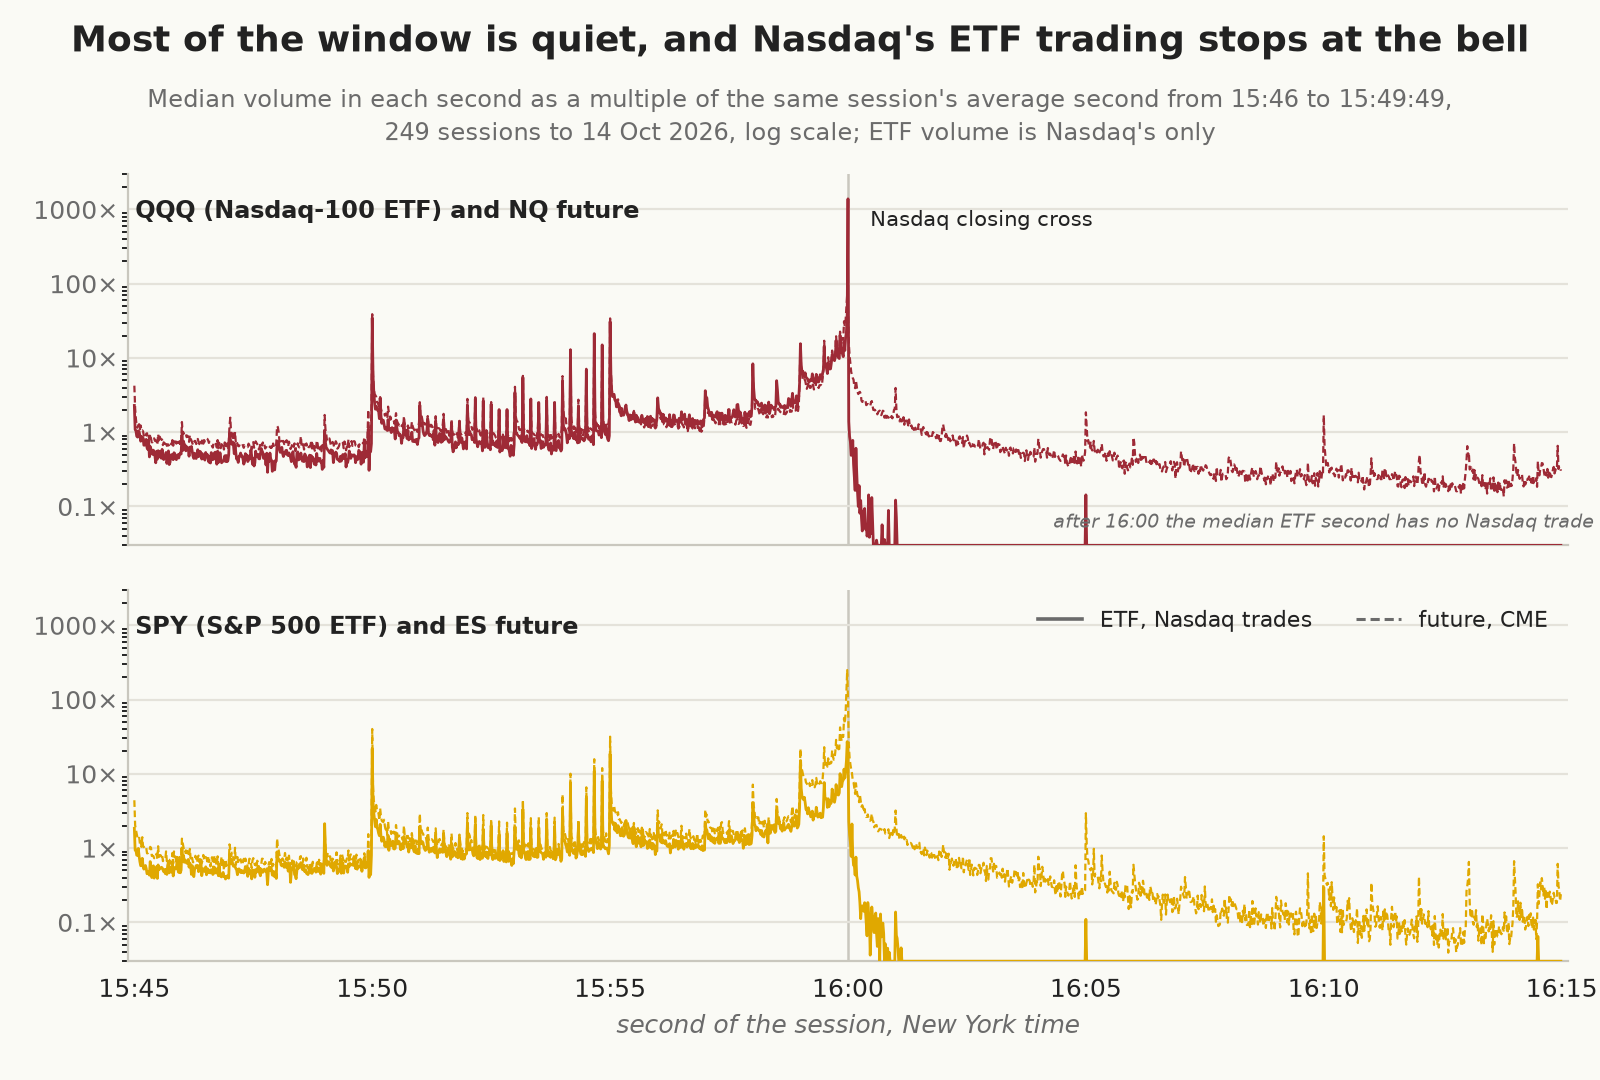
By volume the picture is much the same as in the futures. On Nasdaq the 15:50:00 second trades a median 35 times an average quiet second in QQQ and 22 times in SPY, and the 15:55:00 second 31 and 19 times. The quiet average is a median 427 QQQ shares and 695 SPY shares a second on Nasdaq, and 15% and 12% of those quiet seconds have no Nasdaq trade at all. The 16:00:00 second in QQQ, which holds Nasdaq’s closing cross, is a different order of magnitude, at a median 1,400 times a quiet second.
SPY keeps Nasdaq’s timetable
QQQ is listed on Nasdaq, and so are the stocks it holds, so it isn’t surprising that its price jumps when Nasdaq publishes its closing-auction information. SPY is listed on NYSE Arca, and its own official close comes from Arca’s closing auction, which publishes imbalance information from 15:00, accepts market-on-close orders until 15:59, and runs at 16:00, with nothing scheduled at 15:50 or 15:55. What matters, though, is where SPY’s stocks are listed. Its largest holdings (Nvidia, Microsoft, Apple, Amazon, Alphabet, Meta, Broadcom, and Tesla) are all Nasdaq-listed, and their closing crosses run to Nasdaq’s timetable, so if the information comes from the stocks we’d expect SPY’s bursts to sit on Nasdaq’s seconds, which they do. Its 15:59:00 second is no different from QQQ’s or the futures’ (1.2 basis points, against 1.3 for QQQ and 1.4 for ES), so the start of Arca’s freeze doesn’t stand out.
Matching clock times could be a coincidence, so the stronger evidence is the three rule changes of 2018 and 2019, all of which the ETF data (from May 2018) catches. Nasdaq moved its market-on-close cut-off and the start of its imbalance publication from 15:50 to 15:55 on 29 October 2018. NYSE moved its own from 15:45 to 15:50 on 1 April 2019, and on 4 November 2019 Nasdaq added the early imbalance message at 15:50, published every 10 seconds, and stopped on-close orders from being cancelled after 15:50.
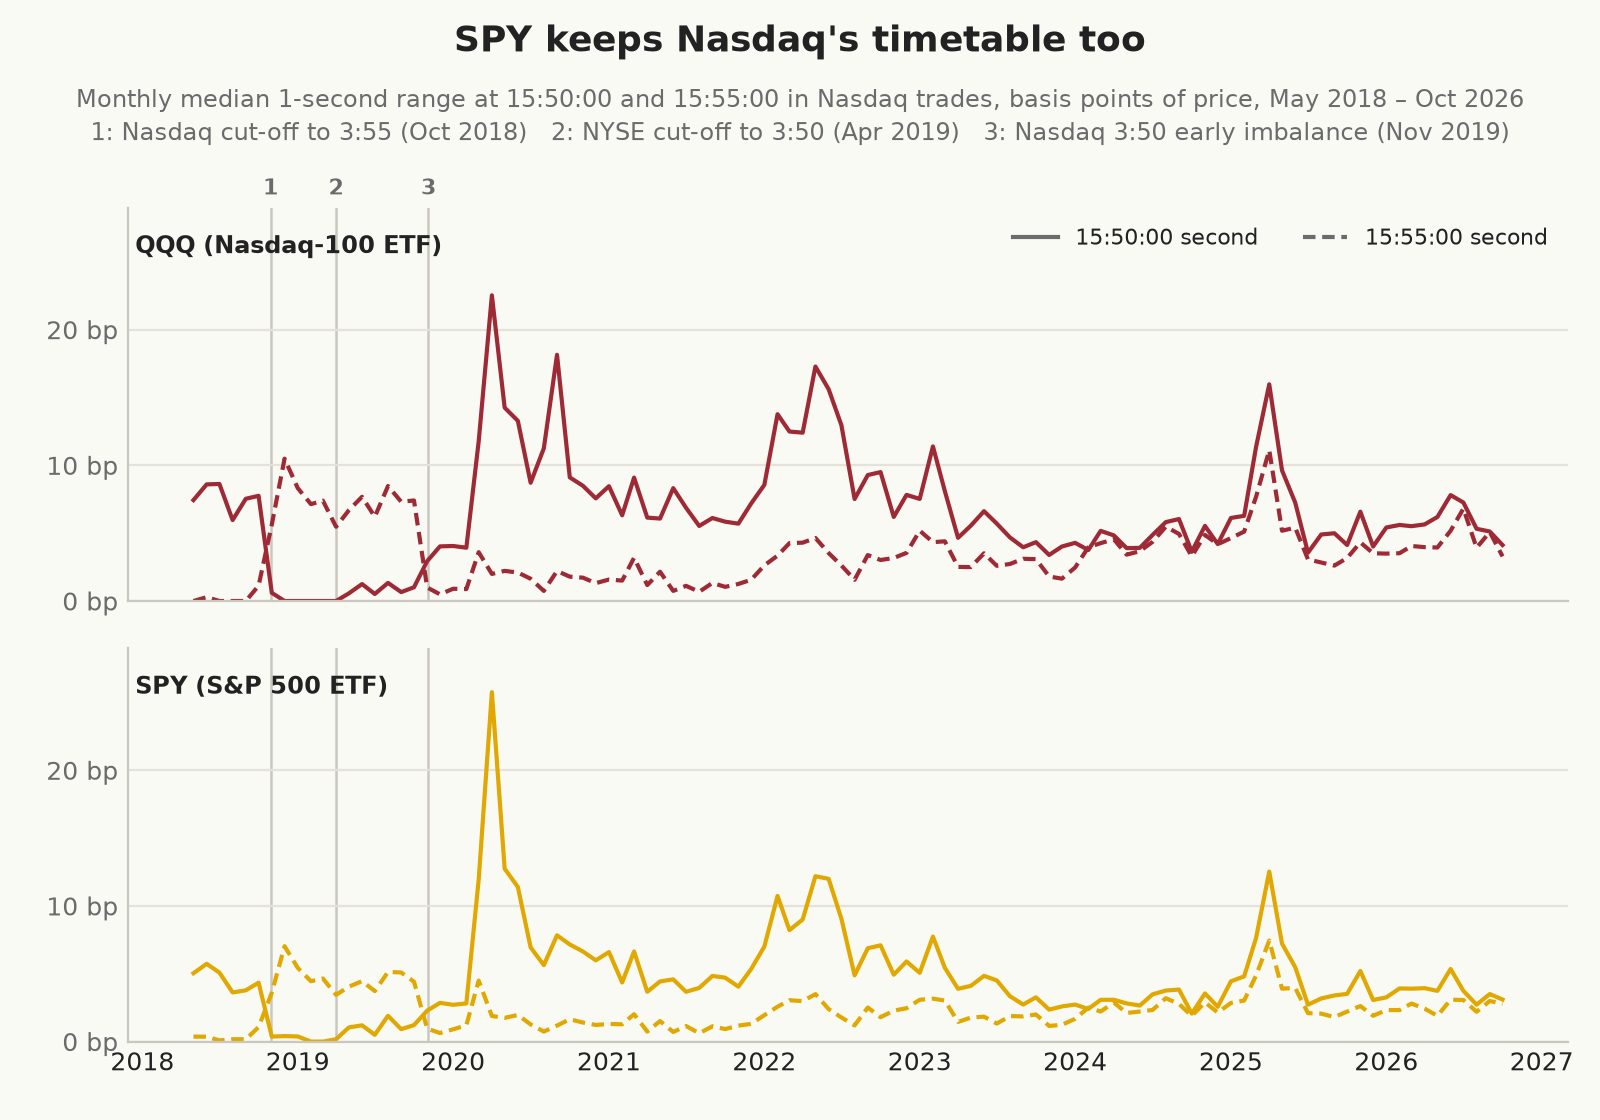
Basis points of price. One basis point was about 1.7 cents of QQQ and 2.8 cents of SPY at 2018 prices.
| Period | QQQ | SPY | NQ | ES |
|---|---|---|---|---|
| May–Oct 2018 | 7.6 / 0.0 | 4.5 / 0.3 | 7.5 / 0.7 | 4.3 / 0.9 |
| 29 Oct 2018 – Mar 2019 | 0.0 / 8.1 | 0.4 / 5.1 | 0.8 / 8.6 | 0.9 / 5.6 |
| Apr–Oct 2019 | 0.5 / 6.8 | 0.9 / 4.2 | 1.3 / 7.7 | 0.9 / 5.0 |
| 4 Nov 2019 – Feb 2020 | 3.5 / 0.9 | 2.6 / 0.9 | 4.2 / 1.6 | 3.0 / 1.5 |
| Past year | 5.6 / 4.1 | 3.7 / 2.6 | 6.2 / 4.3 | 4.2 / 2.9 |
Median one-second range in basis points at 15:50:00 / 15:55:00. A median of zero means that on most days Nasdaq printed only one price in that second. The futures’ 2018 figures leave out the summer sessions whose bars are a second late (see below).
Both ETFs switched seconds in the week of 29 October 2018, and both switched back in the week of 4 November 2019. SPY’s 15:55:00 second went from 0.3 basis points to 5.1, and NYSE’s April 2019 change, which covers most of the S&P 500 by number of stocks, made no visible difference. So SPY, like the Dow futures in the earlier post, keeps Nasdaq’s closing timetable. That fits a burst that starts in the auction information for Nasdaq’s stocks and spreads to everything priced from them, futures and ETFs alike, through the arbitrage that ties them together. It doesn’t show which market the orders arrive in first, though, and testing the idea properly would take the imbalance messages for the stocks themselves.
The ETF data also settles a question the futures post left open. In the futures archive, one-second bars from 7 May to 3 August 2018 put the 15:50 burst at 15:50:01 on 98% to 100% of days, depending on the contract, which we put down to a one-second timestamp offset in the archive and left out. Nasdaq’s ETF bars for the same weeks put the burst at 15:50:00 on every day, so the offset was in the futures bars and the market was keeping time as usual.
Measured by volume, the 15:55:00 burst has grown in the ETFs as it has in the futures. In QQQ it traded four to nine times an average quiet second from 2020 to 2022, 21 times in 2023, and 30 to 35 times from 2024, and in SPY it went from three to five times to about 20. The 15:50:00 burst in QQQ was at its biggest in 2020 and 2021, at 53 and 65 times, and has run at 31 to 41 times since.
The ETFs have a close you can trade at
At the close itself the ETFs and the futures part company, because QQQ’s official closing price, the one a daily bar records, is set by Nasdaq’s closing cross, an auction that executes market-on-close orders, and the limit-on-close orders whose limits allow it, at a single price. It prints a median 218 milliseconds after 16:00:00, and in the past year it traded a median 550,000 shares, 5.7% of Nasdaq’s QQQ volume for the whole regular session and a third of everything Nasdaq traded in QQQ between 15:45 and 16:15. An order entered as market-on-close fills at that price, so a daily-bar backtest that exits QQQ “at the close” can describe something that can actually be done, on two conditions. The bar’s close has to be the official closing price (Nasdaq’s, for QQQ), which isn’t always what a data vendor’s daily bar uses, so it’s worth checking. And the decision to exit has to be made before the order cut-off, from what was known then. A rule that looks at the finished daily bar (its close or its range, for instance) to decide whether to exit can’t also assume a market-on-close order that had to be sent before that bar existed. A rule to sell at the close when the close is below its 20-day average, for example, needs a close that doesn’t exist until after 16:00, while the order had to be in by 15:55, so a backtest that books the sale at that close is trading on information it couldn’t have had. A rule that decides from yesterday’s close, or from the price at 15:50, doesn’t have that problem. The futures have no closing auction, so there’s no equivalent order for them.
The cross price usually sits a little away from the last price before it. Measured against the last Nasdaq trade before 16:00, or against Nasdaq’s mid just before it, the cross was a median 0.70 basis points away, a basis point or more on 31% of days, more than 2.1 on one day in ten, and about 13 on its worst day. That gap measures how far the official close, which a daily backtest assumes, sits from the last trade before it. An order actually sent at 15:59:59 would trade in the continuous market at whatever price it met there, and the next section measures that separately.
The catch is that Nasdaq accepts market-on-close orders only until just before 15:55:00, and hasn’t let them be cancelled or changed after 15:50:00 since November 2019, except to correct an error. An order entered between 15:50 and 15:55 is fixed as soon as it’s in, and one entered earlier can be cancelled only until 15:50. Either way the position rides through the 15:55:00 burst and the last five minutes, and an order entered before 15:50 that stays in rides through the 15:50:00 burst as well. Between the last moment to send one, just before 15:55:00, and the cross, Nasdaq’s QQQ price moved a median 6.4 basis points, and more than 20 on one day in ten. A market-on-close order saves the cost of trading in a hurry, and the price of that saving is a decision made at least five minutes before the fill that can’t be taken back.
Nasdaq has one more way to get the official close. Since March 2022 its Extended Trading Close has matched orders in Nasdaq-listed securities at the official closing price from the end of the cross until 16:05, and limit-on-close orders that the cross didn’t fill can roll into it. It needs someone on the other side, though, and in QQQ it’s small: in the past year trades at exactly the closing price between the cross and 16:05 came to a median of about 400 shares a day on Nasdaq, against 550,000 in the cross itself. It can sometimes get the closing price after the bell, with no guarantee that it will.
SPY’s official close is set in NYSE Arca’s auction, which this data can’t see. Arca’s market-on-close orders can be entered until 15:59, which leaves an SPY exit four more minutes than QQQ’s. On Nasdaq, SPY simply goes on trading through 16:00:00, at a median 19 times a quiet second’s volume, and we can’t measure how far Arca’s closing price sits from it.
What a market order costs
As with the futures, the number that matters for an exit is the bad tail. A simulated QQQ market order sent at exactly 15:55:00, arriving 50 milliseconds later, filled at least one basis point (about 6.4 cents) worse than the earlier mid on 39% of fills (36–42%), with a worst fill 7.8 basis points worse. An order sent at 15:50:00 did so on 45% of fills, while the same order sent a few seconds off a round time almost never filled a basis point worse, with a 90th-percentile cost of 0.25 to 0.35 basis points, a cent or two. Being faster helps in the model without removing the risk: of QQQ orders sent at 15:55:00, 14% were already a basis point worse after 10 milliseconds, 32% after 25, and 39% after 50, and only an order that arrives before the second turns gets the price on the screen. At random moments away from the round seconds, the median QQQ trade price hadn’t moved at all a quarter of a second later, while after 15:50:00 it had moved 2.0 basis points within 25 milliseconds.
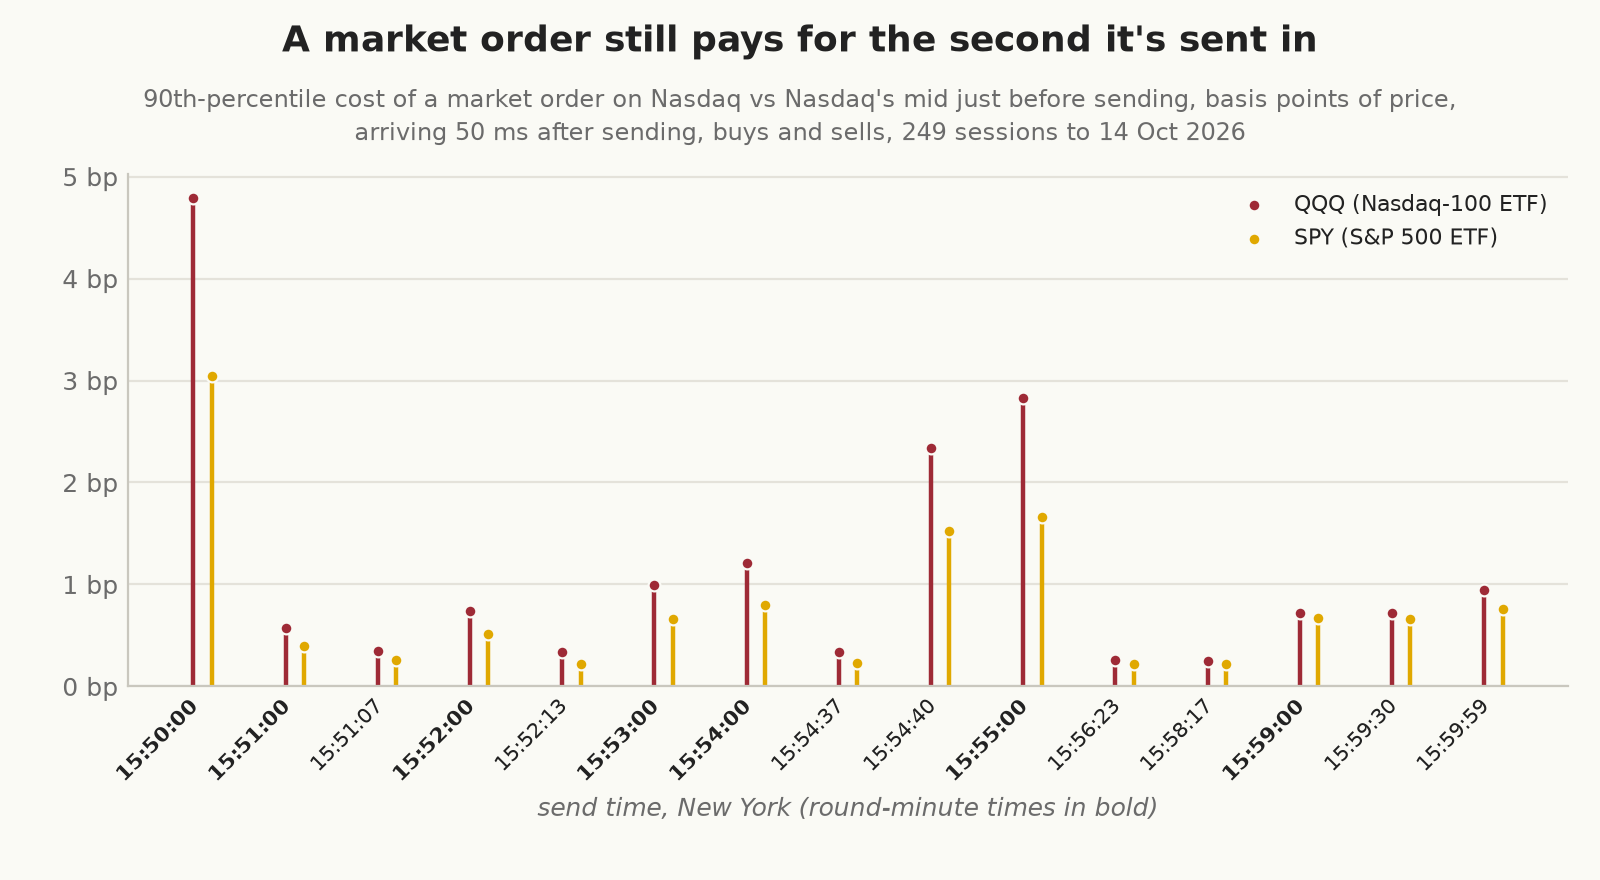
Basis points of price. At the past year’s median prices one basis point is about 6.4 cents of QQQ and 7.0 cents of SPY.
| Send time | QQQ | SPY |
|---|---|---|
| 15:50:00 | 4.8 (4.4–5.3) | 3.0 (2.8–3.4) |
| 15:55:00 | 2.8 (2.5–3.2) | 1.7 (1.5–1.8) |
| 15:54:40 | 2.34 | 1.53 |
| 15:54:00 | 1.21 | 0.80 |
| 15:53:00 | 0.99 | 0.66 |
| 15:52:00 | 0.74 | 0.52 |
| 15:51:00 | 0.57 | 0.40 |
| 15:59:00 | 0.72 | 0.67 |
| 15:59:30 | 0.72 | 0.66 |
| 15:59:59 | 0.95 | 0.76 |
| 15:51:07 | 0.35 | 0.26 |
| 15:52:13 | 0.34 | 0.22 |
| 15:54:37 | 0.34 | 0.23 |
| 15:56:23 | 0.26 | 0.22 |
| 15:58:17 | 0.25 | 0.22 |
90th-percentile price slippage in basis points against Nasdaq’s mid just before sending, positive being worse for the order, without fees, arriving 50 milliseconds after sending. A buy and a sell each session give 498 fills at each send time from 249 sessions, and the 95% bootstrap intervals for the bursts resample sessions. The share of fills a basis point or more worse than the mid is 45% at 15:50:00 and 39% at 15:55:00 in QQQ, 39% and 28% in SPY, and under 1% at the off-minute times. As in the futures post, the off-minute times illustrate a rule and were picked from the same data, so they aren’t recommended seconds.
QQQ’s tail at 15:50:00 and 15:55:00 is about the same as NQ’s in the futures post (4.7 and 2.5 basis points), and SPY’s matches ES’s at 15:50:00 (3.1) and is a little smaller at 15:55:00 (1.9). The 10-second mark at 15:54:40 costs as much as 15:55:00 itself, and the round minutes between the bursts cost more as 15:55 approaches. The last second before the bell, 15:59:59, which the futures post couldn’t price, costs more than a quiet second but far less than the bursts, with a 90th percentile of 0.95 basis points in QQQ and 0.76 in SPY, between a third and a half of the 15:55:00 figure. That second is busy, with a median range of about two basis points, but its price moves in small steps, so an order 50 milliseconds behind the screen seldom misses by much.
The average slippage of a buy and a sell together comes out at exactly half the spread on arrival, because both are measured from the same earlier mid, so every cent the price moves against the buy is a cent in the sell’s favour. That’s a property of the test, and a real strategy’s exits, whose direction may well be related to the burst’s, could average more or less. In the bursts Nasdaq’s book opens up for a moment, so the average rises to 0.52 basis points at 15:50:00 and 0.38 at 15:55:00 in QQQ, and 0.32 and 0.20 in SPY, against about 0.1 at the off-minute times. As with the futures, though, the bigger risk is in the spread of outcomes.
We can’t say much about size, because we downloaded only the top of Nasdaq’s book. Just before 15:55:00 it displayed a median 170 QQQ shares (about $111,000) and 244 SPY shares (about $174,000) at each of the best bid and offer, and a larger order’s cost would depend on what sits behind them, on Nasdaq and on the other exchanges.
A fee came back and the spreads widened
Halfway through our year the quotes in both ETFs changed on every exchange at once, and the cause was a fee. Under Section 31 of the Securities Exchange Act, the exchanges pay the SEC a fee on the value of every sale, and brokers pass it on to the seller. The SEC set the rate to zero from 14 May 2025, because it expected to have collected that fiscal year’s budget already, and in February 2026 announced it would return, at $20.60 per million dollars of sales, for sales charged from 4 April. Nasdaq applied it to sells executed from trade date 2 April, which settled on 6 April after Good Friday. The fee is 0.206 basis points of the sale, and at the past year’s median prices that’s 1.3 cents per QQQ share sold and 1.5 cents per SPY share. A market maker quoting a one-cent market earns one cent per share on a round trip, before rebates and before the losses to better-informed traders, so the fee on the sale alone now costs more than the whole spread.
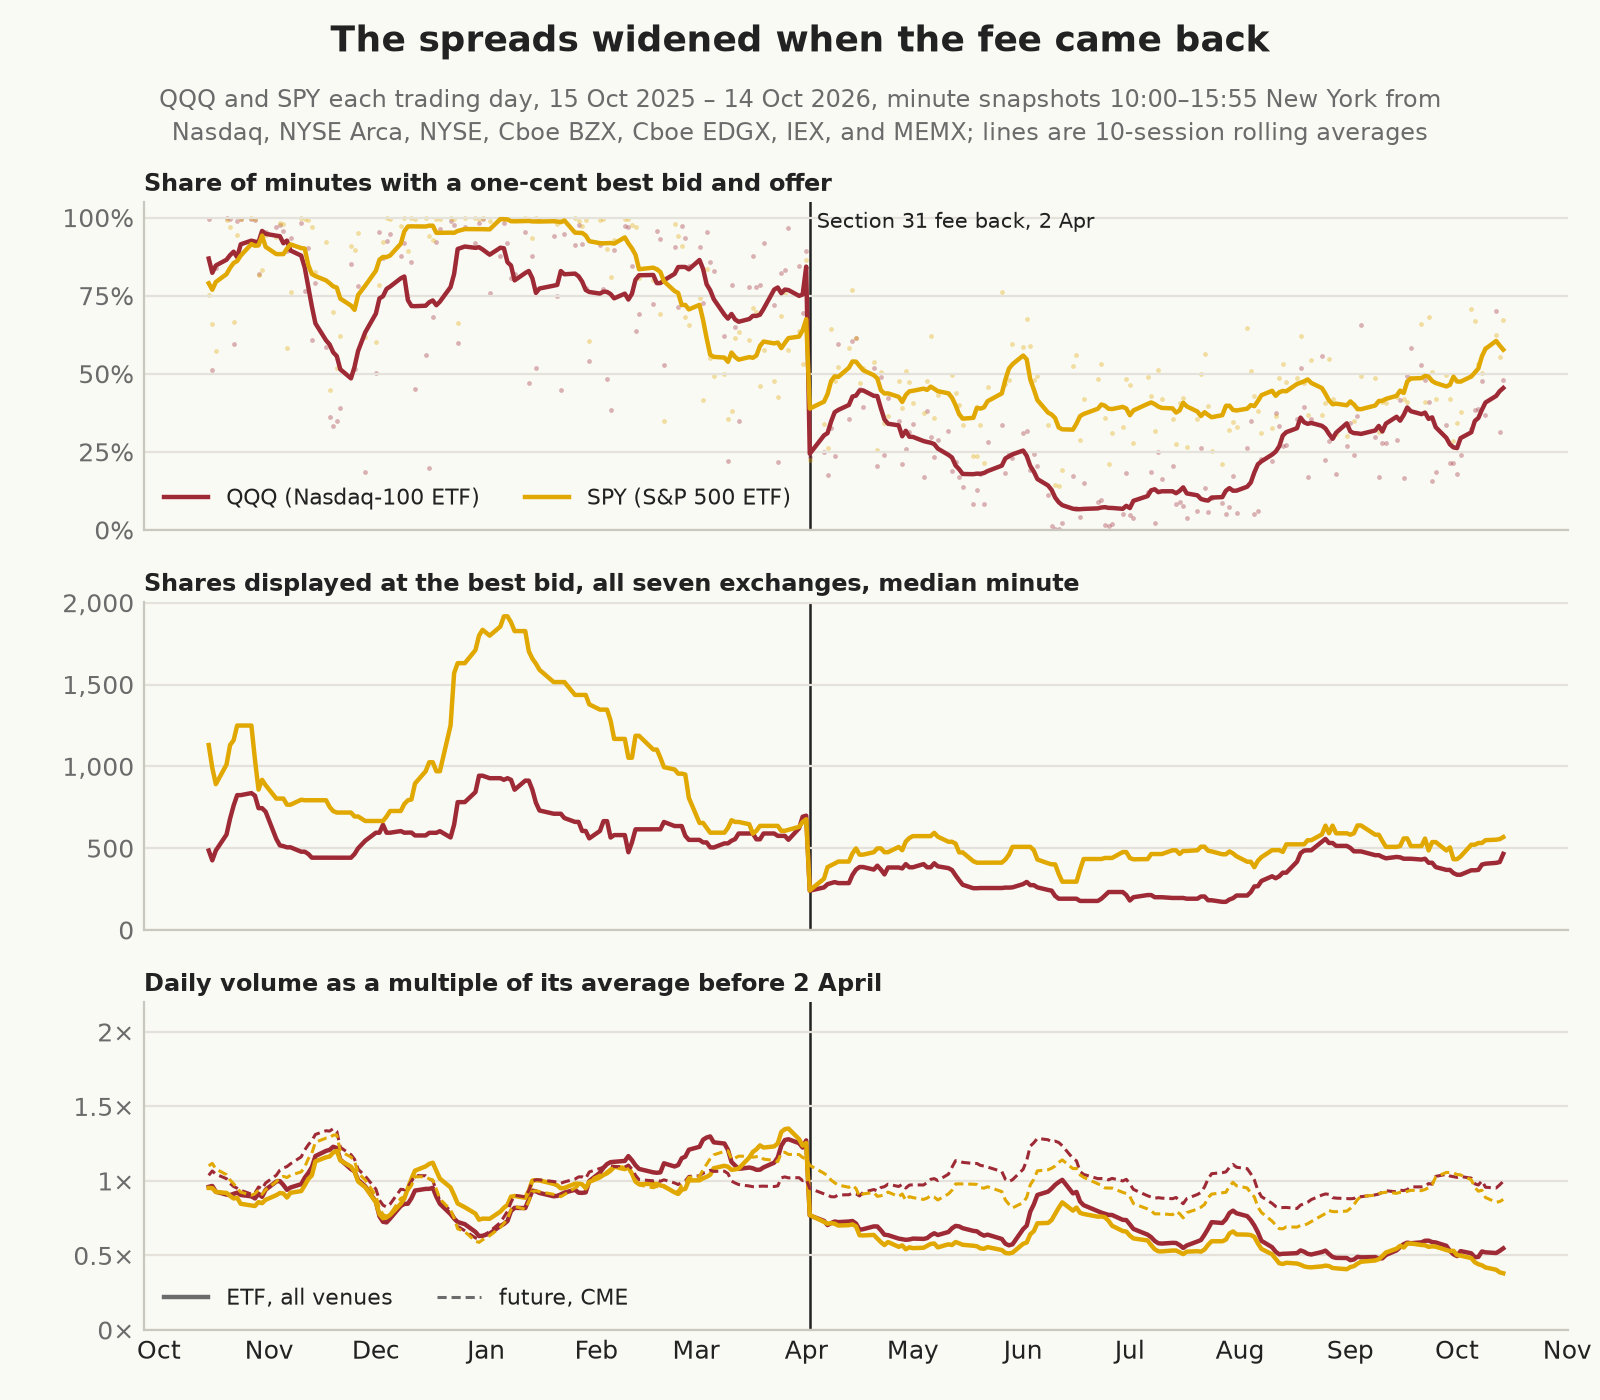
Across the seven largest lit exchanges, between 10:00 and 15:55, the quotes changed that day: QQQ’s best bid and offer was a cent wide in 78% of minutes before 2 April and in 25% after, and SPY’s in 83% and 43%. The average spread went from 1.3 cents to 2.5 in QQQ and from 1.2 to 1.8 in SPY, and the shares displayed at the best bid across the seven exchanges roughly halved, from a median 594 to 320 in QQQ and from 945 to 490 in SPY. Consolidated volume fell by 39% in QQQ and 44% in SPY, while NQ’s volume, which pays no Section 31 fee, barely moved (down 2%) and ES’s fell by 14%. The spreads stayed wide through the quiet months of August to October, so volatility doesn’t explain them, and there were no half-penny quotes before or after.
The size of the change also tracks the size of the fee per share, which grows with the price. XLF and TLT, at about $53 and $87, pay 0.1 to 0.2 cents a share and stayed a cent wide almost all the time. NVDA and IWM, at about $200 and $270, pay 0.4 to 0.6 cents and went from a one-cent market in 96% and 97% of minutes respectively to 57% and 66%, and QQQ and SPY, at 1.3 to 1.5 cents, moved the most. IEX found the same in a June 2026 study of QQQ, SPY, and IWM using the consolidated tape, and the reverse when the fee went to zero in May 2025. The fee’s return and its date are documented; that market makers widened their quotes because of it is an inference, but the date, the price pattern, and the futures, which don’t pay the fee and didn’t change, all point the same way.
The fee raises the costs above in two ways, and the first is the wider spread, which lifted the average slippage at the off-minute times from 0.10 basis points before 2 April to 0.17 after in QQQ, and from 0.08 to 0.13 in SPY. The second is that a seller now pays the fee itself, where the broker passes it on. If we add 0.206 basis points to each sell after 2 April, then an off-minute buy and sell together come to 0.27 basis points in QQQ and 0.23 in SPY, and a sell alone to 0.38 and 0.34. For a sell in a quiet second, then, the fee is now bigger than the slippage itself. The tails moved less: QQQ’s 90th percentile at 15:55:00 was 2.5 basis points before and 3.2 after (3.4 with the fee), with 39% of fills a basis point worse in both periods. SPY’s went from 1.6 to 1.7 (1.8 with the fee), and none of these figures includes commissions or exchange fees.
After the bell
The stock market’s regular session ends at 16:00, while the futures trade on until 17:00, options on SPY and QQQ until 16:15, and the ETFs themselves in Nasdaq’s after-hours session. In those 15 minutes the ETFs’ trading on Nasdaq almost stops. In the first minute after the bell they trade on Nasdaq in about 45% of seconds, falling to about 20% by 16:12, while the futures go from 98% to about 70%, and the whole quarter-hour after the bell carries about 7% of Nasdaq’s QQQ volume between 15:45 and 16:15 and 11% of its SPY volume, against 20% of ES’s and 25% of NQ’s. Measured by the high and low of Nasdaq’s trades, the average one-second range from 16:00:01 to 16:15 is 0.08 basis points in QQQ and 0.06 in SPY, against 0.38 in NQ and 0.27 in ES.
That comparison flatters the futures, though, because a second with one trade, or none, has no range however far the price has moved since the last one. If SPY prints once at $700.00 and once, a second later, at $700.20, both seconds have a range of zero. The quotes don’t have that problem, so we also measured how far the mid of Nasdaq’s best bid and offer moved, against the mid of CME’s, sampled each second on the same clock.
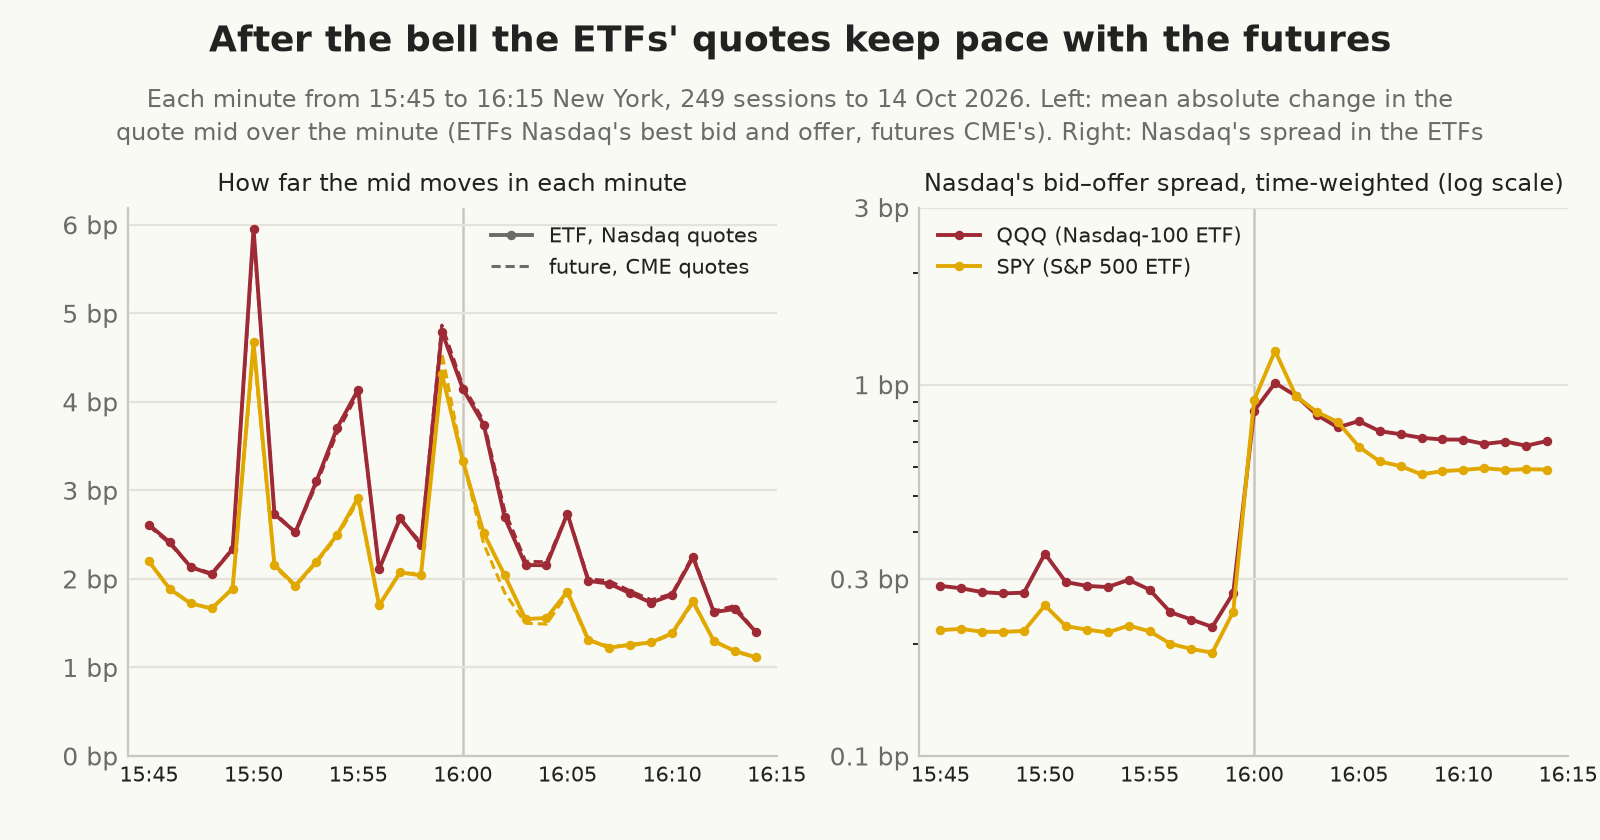
By the quotes, the ETFs keep pace with the futures after the bell. In the five minutes from 16:00:30, QQQ’s Nasdaq mid moved a median 3.5 basis points, the same as NQ’s, and SPY’s moved 2.7, the same as ES’s, and minute by minute the four lines in the chart barely separate. Second by second the match is looser after the bell than before it, since the correlation of one-second moves falls from 0.97 to 0.87 between QQQ and NQ, and from 0.95 to 0.54 between SPY and ES, where Nasdaq’s SPY quote gets noisy once the spread opens up. We looked for one market leading the other and, at one-second resolution, found almost nothing: in every window about 95% of the ETF’s response to a futures move came in the same second, and the futures’ moves in earlier seconds added only 3% to 6%, after the bell as before it. Whether one side leads by a few milliseconds would need finer data.
Over the year Nasdaq’s spread averaged 0.28 basis points in QQQ and 0.22 in SPY in the quarter-hour before the bell, one or two cents depending on the month. In the quarter-hour after it averaged 0.8 and 0.7 basis points, with a median of five cents in QQQ and four in SPY, and it was wider than a cent 93% and 89% of the time. There’s a faint pick-up in trading in all four in the last minute before 16:15, when the ETF options close.
So after 16:00 the ETFs’ price keeps moving with the futures, and what changes is the cost of trading it. An ETF position that has to be closed after the bell faces a thin book and a spread several times wider, and brokers generally take only limit orders in the after-hours session. A position that can be expressed in futures can still be traded there at something close to normal cost.
Are some days different?
As in the futures post, we compared particular kinds of day with the ordinary days of the same calendar month, over every session since May 2018, using ratios that don’t depend on the price level.
| Kind of day | Days | QQQ volume | SPY volume | QQQ quiet stretch | SPY quiet stretch | QQQ closing cross |
|---|---|---|---|---|---|---|
| Month-end | 101 | 1.53 | 1.75 | 1.44 | 1.65 | 1.08 |
| Quarter-end | 34 | 1.61 | 2.01 | 1.66 | 1.71 | 0.95 |
| Quarterly expiry Friday | 34 | 1.49 | 1.39 | 1.46 | 1.40 | 1.79 |
| December expiry | 8 | 1.54 | 1.94 | 2.77 | 2.11 | 1.32 |
| Monthly options expiry | 68 | 1.14 | 1.07 | 0.92 | 0.95 | 1.13 |
| Russell reconstitution | 9 | 1.62 | 1.59 | 1.69 | 1.37 | 0.87 |
| FOMC day (2021 on) | 46 | 1.32 | 1.33 | 2.27 | 2.07 | 0.89 |
| Ordinary Friday | 262 | 1.11 | 1.09 | 0.95 | 1.02 | 1.07 |
Median ratio to ordinary days in the same month. Volume is Nasdaq’s continuous trading from 15:45 to 16:00, without the cross. The quiet stretch is the average one-second range from 15:51 to 15:54 away from the 10-second marks.
Most of this repeats what we found in the futures: month-ends bring 1.5 to 2 times the usual Nasdaq volume into the closing quarter-hour, quarter-ends a little more in SPY, and FOMC afternoons double the movement between the bursts. The new figure is QQQ’s closing cross, which is no bigger than usual at month-ends or quarter-ends (1.08 and 0.95 times ordinary days, with about half above and half below) but is 1.8 times its usual size on quarterly expiry Fridays, larger on 88% of them. The biggest crosses since 2018 were on the June 2025 expiry (8.8 times an ordinary day), on 9 April 2025, the afternoon the US paused its new tariffs (8.1 times), and on the June and September 2026 expiries (5.8 times each). Our guess is the QQQ options that expire that afternoon and the hedges held against them, but the data doesn’t say who sends those orders. The quarter-hour after the bell is busier on quarterly expiries too, with Nasdaq’s after-hours volume at 1.9 times normal in QQQ and twice normal in SPY, on every one of the 34 for SPY.
What this means for an exit near the close
For a market order the ETFs behave like the futures, with the same risky seconds: 15:50:00 and the 30 seconds after it, the top of every minute, the 10-second marks between 15:52 and 15:55, and 15:55:00 itself. In our model an order sent a few seconds off those times landed among the cheap ones. What that measures is latency risk, and turning it into an exit policy takes more, because each cost is measured from the moment that order was sent, so moving an order a few seconds later can make it look cheaper while leaving out what the price did in the meantime. Whether a delay helps a real strategy depends on comparing its exits from the same decision-time price, with its own directions and sizes, which we haven’t done.
The ETFs differ from the futures in two ways that matter for an exit. One is the market-on-close order, which fills at the official close, the price a daily backtest assumes, at the cost of deciding before 15:55 for QQQ (or 15:50, to keep the right to cancel) and before 15:59 for SPY, then sitting through what’s left of the bursts. It only matches the backtest if the backtest made the same decision with the same information. The other is after 16:00, when the futures are the cheaper place to trade the same exposure, because the ETFs’ Nasdaq book thins out and its spread widens within a minute of the bell, even though the ETFs’ quoted price keeps moving with the futures. Since April 2026 a seller of the ETFs also pays the Section 31 fee, about 0.2 basis points, which the futures don’t.
Caveats
Apart from the seven-exchange spread comparison, everything about the ETFs here is Nasdaq’s slice of the market. Nasdaq is one of more than a dozen US exchanges, and a large share of ETF trading happens off-exchange. So the volume figures understate the ETFs’ total volume, the high and low of a second may miss prints elsewhere, and a second with no Nasdaq trade looks quiet even if the ETF traded on another exchange. The seven exchanges’ best bid and offer is close to the national one, though a few small exchanges are missing from it. The fill model uses only Nasdaq’s displayed best bid and offer, without hidden orders, other exchanges, or market impact, measures price slippage rather than total cost, and hasn’t been checked against real fills. The Section 31 fee changed the market halfway through our year, so figures pooled over the year mix two regimes, and we’ve split the ones where it matters. We downloaded only the top of Nasdaq’s book, so we can’t say what a larger order would cost. SPY’s own closing auction runs on NYSE Arca, which we didn’t look at, and we didn’t buy Nasdaq’s imbalance messages, so the link to the auction timetable is again an inference from timing. The calendar comparisons repeat the futures post’s many tests on new data, so some modest differences among them will be chance.
What’s left
Arca’s own feed would show SPY’s closing auction and how far its price lands from the last trade, and the consolidated tape would give the ETFs’ full volume. Nasdaq’s imbalance messages, which our data plan doesn’t include, would test whether the published imbalance predicts the size or direction of the burst, and they’d be needed for the large Nasdaq-listed stocks in both indexes as well as for QQQ, since the stocks are where we think the information starts. With the ETF and futures messages on synchronised clocks at millisecond resolution, it would also be possible to see which market moves first in each burst. The comparison that matters most is the one we described in the futures post: a real strategy’s positions, at realistic sizes, exited by each candidate policy and measured from the same decision-time price, with fees included and the market-on-close order now one of the policies. Measured that way, the profit or loss while an order waits counts against the policy that waits.
Conclusion
QQQ and SPY jump in the same two seconds as the index futures, by about the same amount, in the same direction, and to the same 10-second rhythm, and they moved with Nasdaq’s rule changes in 2018 and 2019 as the futures did, SPY included. A daily bar of QQQ or SPY hides those seconds just as a daily bar of NQ or ES does. The difference is that the ETFs’ daily close is a real auction price that an order can get, provided it’s in by 15:55 for QQQ or 15:59 for SPY, and provided the decision to send it didn’t depend on the bar it’s meant to close. After 16:00 the ETFs’ quotes keep moving with the futures, but trading them gets thin and expensive, and since April 2026 the Section 31 fee has made the ETFs’ spreads wider all day.
References
- Ohlcv, The importance of some clock ticks late in the day (index futures) (9 October 2026), and the references there for Nasdaq’s and NYSE’s rule changes.
- SEC Release 34-87198, approving SR-NASDAQ-2019-064 (2 October 2019), on cancelling on-close orders after 15:50, https://www.sec.gov/files/rules/sro/nasdaq/2019/34-87198.pdf.
- Nasdaq, Equity Trader Alert 2018-82, “Nasdaq to Implement Closing Cross and NOII Changes on October 29, 2018”, https://www.nasdaqtrader.com/TraderNews.aspx?id=ETA2018-82.
- NYSE, “Auctions”, closing auction timetables for NYSE and NYSE Arca, https://www.nyse.com/trade/auctions.
- Cboe, Equity Options Extended Trading Hours FAQ, on ETF options trading until 16:15, https://cdn.cboe.com/resources/techspec/technical-specifications-equity-options-extended-trading-hours-faq.pdf.
- Nasdaq, TotalView-ITCH 5.0 specification, https://www.nasdaqtrader.com/content/technicalsupport/specifications/dataproducts/NQTVITCHspecification.pdf.
- Nasdaq, Equity Trader Alert 2022-15, on the Extended Trading Close from 7 March 2022, https://www.nasdaqtrader.com/TraderNews.aspx?id=ETA2022-15.
- SEC, Section 31 fee rate advisories: the rate set to $0 from 14 May 2025 (https://www.sec.gov/rules-regulations/fee-rate-advisories/2025-2) and to $20.60 per million from 4 April 2026 (https://www.sec.gov/rules-regulations/fee-rate-advisories/2026-2).
- Nasdaq, Options Trader Alert 2026-14, “Regulatory Transaction Fee Rate Adjustment per SEC Section 31” (31 March 2026), covering Nasdaq’s equity and options markets and applying the new rate to sells from trade date 2 April 2026, https://www.nasdaqtrader.com/MicroNews.aspx?id=OTA2026-14.
- J. Ramsay and S. Stevens, IEX, “The Section 31 Fee Rollercoaster: How to Make for a Smoother Ride” (17 June 2026), https://www.iex.io/article/the-section-31-fee-rollercoaster-how-to-make-for-a-smoother-ride.
Method note: QQQ and SPY from Nasdaq’s TotalView-ITCH feed, Nasdaq trades only: one-second bars for 2,108 full sessions from 1 May 2018 to 14 October 2026, and every trade and top-of-book change from 15:45 to 16:15 for 249 sessions from 15 October 2025. NQ and ES one-second bars, each session’s most-traded outright, on the same sessions. The one-second range is the high minus the low of all trades in a clock second, in basis points of each session’s price, with 95% intervals from a session bootstrap. Costs are the price slippage of hypothetical market orders filled at Nasdaq’s displayed best bid or offer on arrival, without market impact, against Nasdaq’s mid before sending, positive being worse, a buy and a sell each session resampled together, and without fees except where the Section 31 fee is added to sells from 2 April 2026. After the bell, quote mids from Nasdaq’s best bid and offer and CME’s (ES and NQ front contracts by volume, sampled each second) are compared on Databento’s capture clock. The spread comparison uses each exchange’s best bid and offer once a minute from 10:00 to 15:55 on Nasdaq, NYSE Arca, NYSE, Cboe BZX, Cboe EDGX, IEX, and MEMX, with consolidated daily volume. The calendar comparisons use every session from May 2018, each special day against the median of ordinary days in the same month. Every request was priced before download and none was charged.