Do levels at round numbers hold?
Where the belief comes from
The belief that round-number prices act as support and resistance is widely held, and there’s a plausible reason for it. Donaldson and Kim (1993) found the Dow Jones Industrial Average was held back at multiples of 100, but moved further than expected once it broke through one. Carol Osler (2003) studied about 9,700 stop-loss and take-profit orders at a large currency dealing bank and found that take-profit orders cluster at round numbers, while stop-loss orders cluster just beyond them. Take-profits at the number should make trends stall there, and stops just past it should make them speed up once it’s crossed; Osler (2005) found that exchange-rate trends do move faster when rates reach the levels where stops cluster. In US stocks, Bhattacharya, Holden, and Jacobsen (2012) found excess buying a cent below round prices and excess selling a cent above them, and the imbalance grew with the roundness of the price, largest next to whole dollars.
We tested the simplest version of the claim in six CME futures. Specifically, we wanted to know whether, when price reaches a round level for the first time in a while, it turns back more often than it does at any other price. Across 16 years of one-second bars and 19.2 million first touches, round levels turned back less often than ordinary prices in five of the six markets, by as much as 6.0 percentage points, and the shortfall tends to grow with the roundness of the level. Highs and lows seldom stop one tick past a round level, and a month of order-book data shows more size resting at some round prices than at the prices around them.
That test only starts once price has reached the level. If traders who expect resistance at 7,000 sell at 6,995, weak rallies stop short and only strong ones arrive, which on its own would lower the bounce rate at 7,000.00 even if the area around it held. So we also followed every approach from a fixed distance out, whether or not it got to the level. An approach that started 10 ticks short of a round level reached it less often than one heading for an ordinary price, 45.0% of the time against 47.7% in ES, with a larger gap in NQ and smaller ones in CL and ZN. That result is less firm than the touch result, because on one-second bars many approaches start in a second whose range already reaches the failure barrier, and for those we can’t tell whether the fall came before the approach began or after. It suggests that round numbers turn some approaches back before they arrive, while the ones that arrive go through more often.
Data and method
We used one-second bars for six CME futures from our marketfeed archive, which holds Databento’s CME Globex feed, from June 2010 to 19 October 2026, which gives us about 4,200 trade dates per market. On each trade date we used the front month, the contract with the most volume that day. A trade date runs from 17:00 Chicago time to 17:00 the next day, so it includes the overnight session and, in the years when the exchange’s session ran past 16:00, those later trades too.
Each price level belongs to the roundest tier whose step divides it. We call the three roundest tiers in each market “round”, and the least round prices that can trade are the baseline:
| Market | Tick | Tiers, roundest first | Baseline |
|---|---|---|---|
| ES (E-mini S&P 500) | 0.25 | 100, 50, 10, 5, and 1 point | the quarter points between whole points |
| NQ (E-mini Nasdaq-100) | 0.25 | 1,000, 100, 50, 10, and 1 point | the quarter points between whole points |
| CL (WTI crude oil) | 1 cent | $5, $1, 50 cents, 10 cents, and 5 cents | every other cent |
| GC (gold) | 10 cents | $100, $50, $10, $5, and $1 | every other 10 cents |
| 6E (euro) | 0.5 pip from 2016, 1 pip before | 100 pips (a big figure), 50, 10, and 5 | every other whole pip |
| ZN (10-year note) | 1/64 point | whole points, halves, quarters, and 32nds | the odd 64ths |
A touch is the first second in which the high reaches a level after 30 minutes in which every high was below it, or the first second in which the low reaches a level after 30 minutes above it. From that second we follow the bars until price has moved a distance X back away from the level (a bounce) or X through it (a break), whichever comes first, inside the same trade date. X is 5% of the median daily range over the previous 20 trade dates, rounded to whole ticks, which in ES has grown from three ticks in 2012 to 16 now. We repeated everything with X at 15%, and with X fixed at 10 ticks.
One-second bars don’t say in what order the trades inside a second happened. A break can be scored in the touching second, because price had to pass through the level to get X beyond it, but a bounce is only scored from the next second on, since a low X below the level in the touching second may have come before the touch. Between 1.5% and 7% of touches, depending on the market, had a touching second that already reached X back. We left those out of the main results and scored them four other ways in the checks below, including the two that move the round-minus-baseline gap furthest in each direction. About 1% of the remaining touches ran to the end of the trade date without resolving, and under 0.05% were decided both ways inside one later second; both were dropped (the method notes at the end count the touches through each step).
We replayed the test on every trade in the six front months for 18 trade dates, where the order of events is known: ten from 28 September to 9 October 2026, and the eight most volatile trade dates of the past year. For round and baseline levels alike, between 83% and 100% of the one-second touches matched a touch of the same level in the trades within two seconds (95% to 100% outside one market on the volatile days). On the touches both methods resolved, at least 99.3% of outcomes agreed, and the round-minus-baseline gaps from the bars and from the trades differed by at most 0.3 points. Each method also admits a slightly different set of touches, because the bars leave out the ambiguous ones and the trades don’t, and the gaps from each method’s own set differed by up to 2 points; the method notes give both comparisons, with the counts. Agreement on the touches both methods resolve doesn’t show that leaving out the ambiguous ones is harmless, and those end-to-end differences are as large as some of the recent yearly gaps. The fixed hurdle we used is 10 ticks, used only in the years when fewer than 10% of its touches were ambiguous; that limit is a working rule, and the bounds and the replay are the stronger checks.
The bars needed cleaning first, because one-second 6E bars from 2010 to 2015 carry thousands of isolated prints a year at prices far from where the euro was trading. On 3 January 2012, for example, a 10-lot traded at 1.2968 with the market around 1.3040, and the same price came back several times that day. They may be the legs of spread trades, but we haven’t checked. A touch study is sensitive to them because a single bad high touches every level it passes, so we dropped any price more than 15% of a typical day’s range from the median of the 21 bars around it. That removed about 76,000 6E bars, almost all before 2016, and between 300 and 900 bars in each of the other markets. Counted in touches, the filter matters only for 6E, where 22% of the unfiltered touches came from prints it removed; elsewhere it added, removed, or relabelled under 1% of touches. The checks below include the results without it.
Picking each day’s front month by that day’s volume uses hindsight, which a live system couldn’t, though it only matters on the few days a year when two contracts trade similar volume. Touches on the same day aren’t independent (a fast move touches many levels at once), so the 95% intervals come from resampling whole trade dates.
For the order book, we downloaded Databento’s ten-level book (MBP-10) for the six front months in two-minute windows starting at 08:35, 09:30, 10:30, 11:30, and 12:30 Chicago time, on the 20 trade dates from 21 September to 16 October 2026: 200 minutes of book per market, or 12,000 one-second snapshots.
Round levels hold less often once they’re reached
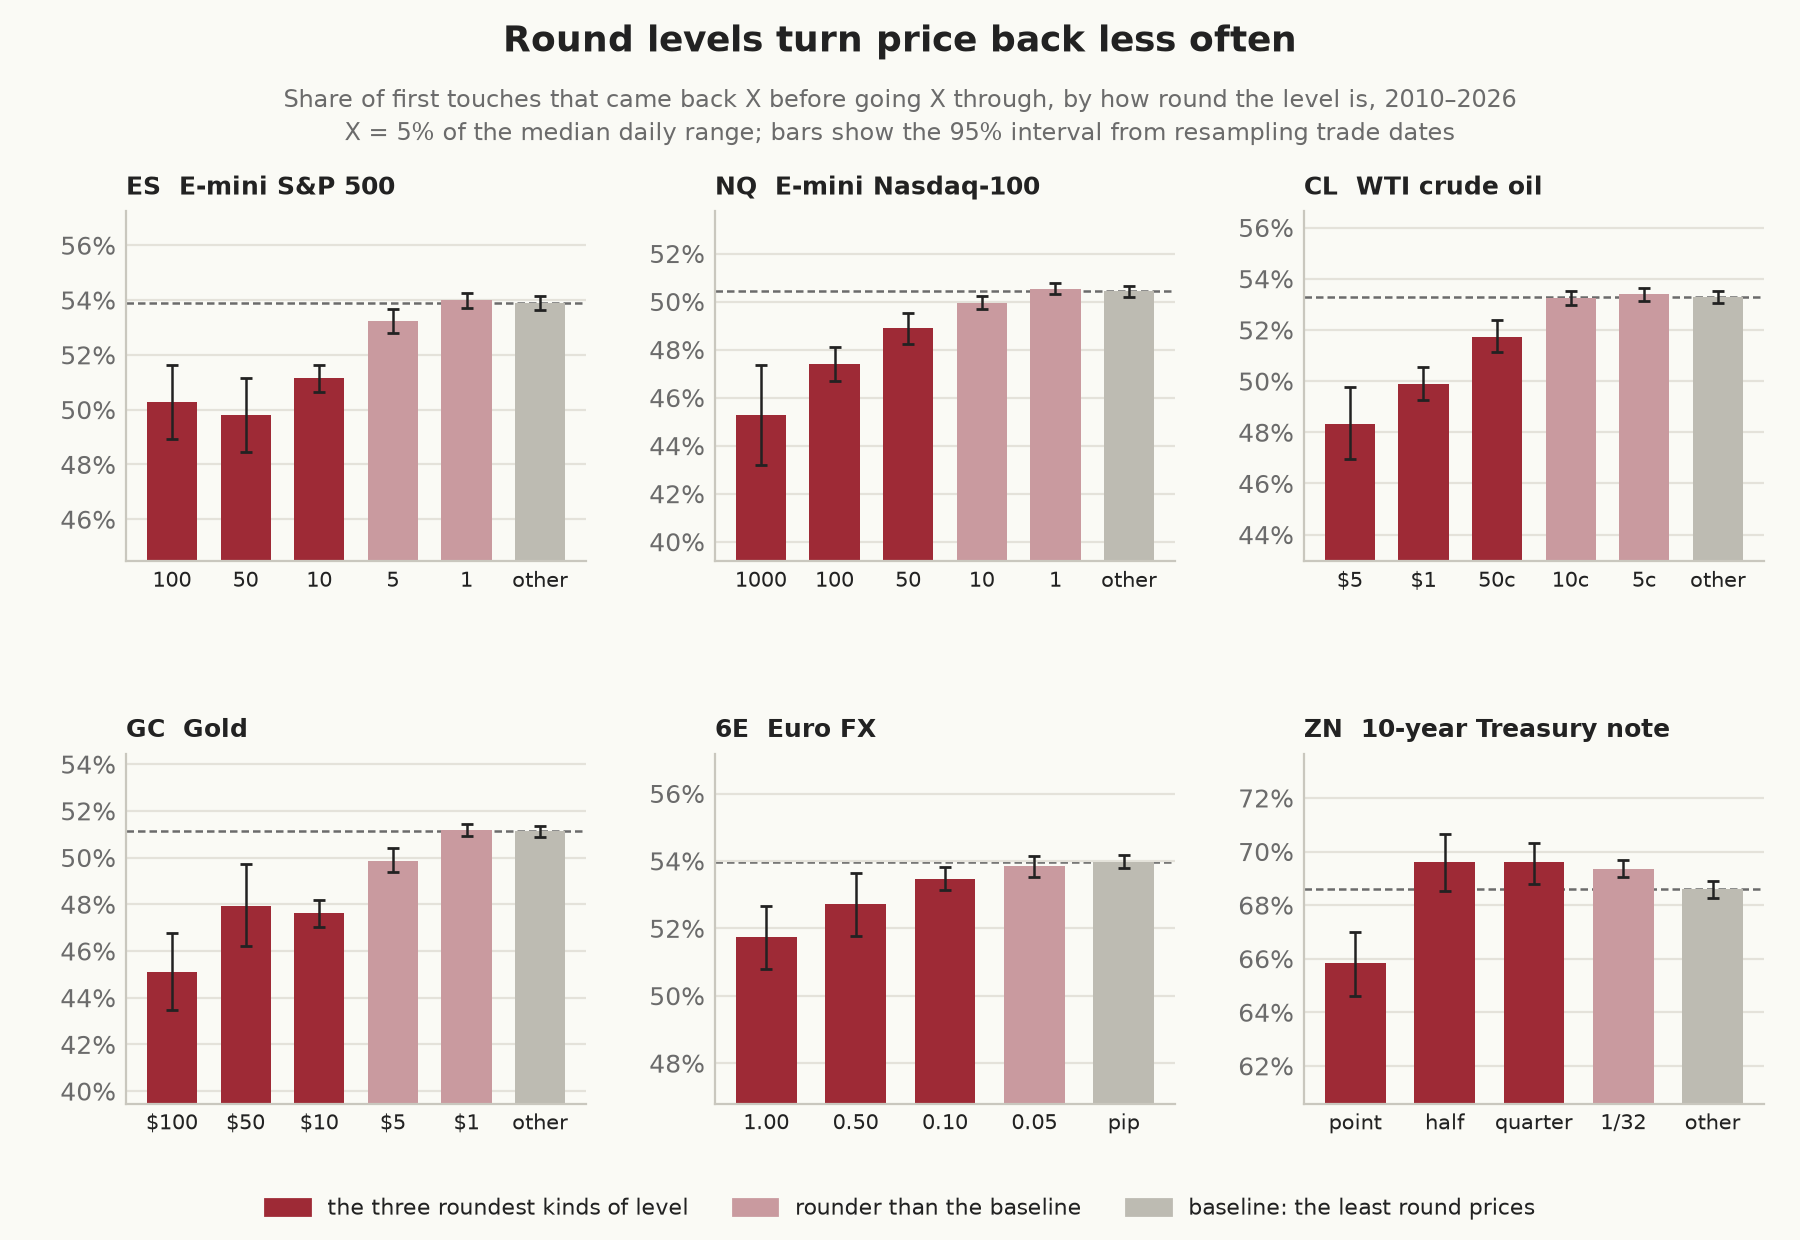
In ES, 53.9% of touches at quarter-point prices turned back before going through. At 10-point levels the figure was 51.2%, and at 50- and 100-point levels about 50%. Whole points and 5-point levels sit with the baseline or close to it, so in ES the shortfall starts at the 10-point levels. The other markets fall the same way, though not in strict order of roundness (in ES the second tier falls further than the first, and in GC the third falls a little further than the second):
| Market | Baseline | Roundest tier | Second | Third |
|---|---|---|---|---|
| ES | 53.9% | 100 points: −3.6 (−4.9, −2.3) | 50: −4.1 (−5.4, −2.8) | 10: −2.8 (−3.2, −2.3) |
| NQ | 50.4% | 1,000 points: −5.1 (−7.2, −3.1) | 100: −3.0 (−3.7, −2.4) | 50: −1.5 (−2.2, −0.9) |
| CL | 53.3% | $5: −4.9 (−6.3, −3.6) | $1: −3.4 (−4.0, −2.8) | 50 cents: −1.5 (−2.1, −1.0) |
| GC | 51.1% | $100: −6.0 (−7.6, −4.4) | $50: −3.2 (−4.8, −1.5) | $10: −3.5 (−4.0, −2.9) |
| 6E | 54.0% | big figure: −2.3 (−3.1, −1.4) | 50 pips: −1.3 (−2.2, −0.4) | 10 pips: −0.5 (−0.8, −0.2) |
| ZN | 68.6% | whole point: −2.8 (−3.9, −1.6) | half: +1.0 (0.0, +2.0) | quarter: +1.0 (+0.3, +1.8) |
Bounce rate at the baseline, and the difference at each round tier in percentage points with its 95% interval; X is 5% of the daily range. After a Holm correction for the 28 tier comparisons, 16 of these 18 differences are still significant at 5%, all of them negative; the two that aren’t are ZN’s halves and quarters.
The roundest tiers rest on fewer prices and days than their touch counts suggest. ES’s 100-point row is 4,987 touches of 68 different levels on 1,605 trade dates, and GC’s $100 row is 3,369 touches of 46 levels on 1,075 dates, so a few levels that price visited often carry a lot of weight there.
In ZN only the whole points turn back less often. Its halves and quarters turn back about a point more often than other 64ths, which doesn’t survive the correction, and its baseline is far higher, at 68.6%. X is only two or three ticks in ZN, so our guess is that trades alternating between the bid and the offer account for many of those quick reversals. We haven’t checked that against quotes, and ZN’s bounce rates shouldn’t be set beside the other markets’ rates, only beside each other.
Round levels give way more often both when price comes up to them and when it comes down, a little more often from above (in ES, 3.4 points below the baseline from above and 2.6 from below), and by about the same margin in the day session and overnight.
Five minutes after touching an ordinary price in ES, price had drifted back by 0.06 X on average, the small reversal you’d expect at a new 30-minute high or low. After touching a round level it was, on average, where it had touched, and 44% of the time it was on the far side, against 41% for ordinary prices. GC, CL, and NQ show the same difference.
How firm the result is
We checked the gap a dozen ways, and each row below is the three roundest tiers together minus the baseline, in percentage points:
| Check | ES | NQ | CL | GC | 6E | ZN |
|---|---|---|---|---|---|---|
| Main result (X = 5% of the daily range) | −3.0 | −2.4 | −2.6 | −3.7 | −0.8 | +0.1 |
| X = 15% of the daily range | −1.5 | −1.0 | −1.1 | −1.5 | −0.3 | −0.5 |
| X fixed at 10 ticks, years with under 10% ambiguous | −3.3 | −2.7 | −2.6 | −3.8 | −0.6 | −0.5 |
| The same years, X = 5% of the daily range | −3.0 | −2.1 | −3.2 | −4.6 | −0.8 | +0.1 |
| Touch after 5 minutes away | −1.9 | −1.7 | −1.6 | −2.0 | −0.5 | −0.2 |
| Touch after 2 hours away | −4.0 | −3.1 | −3.4 | −5.4 | −1.0 | +0.1 |
| Without the last two hours of the trade date | −3.0 | −2.6 | −2.6 | −3.8 | −0.8 | 0.0 |
| The same, X = 15% | −1.5 | −1.0 | −1.1 | −1.5 | −0.3 | −0.4 |
| Each trade date weighted equally | −3.7 | −3.0 | −3.4 | −6.0 | −1.0 | −0.5 |
| Within strata of year, session, volatility, approach speed, and volume | −3.0 | −2.4 | −2.6 | −3.7 | −0.8 | +0.1 |
| Without the price filter | −3.0 | −2.4 | −2.6 | −3.7 | −0.7 | +0.1 |
| Ambiguous touches all counted as bounces | −3.1 | −2.4 | −2.7 | −4.1 | −0.9 | 0.0 |
| Ambiguous touches all counted as breaks | −2.7 | −2.3 | −2.1 | −3.0 | −0.6 | +0.4 |
| Ambiguous: round as bounces, baseline as breaks | −1.8 | −1.7 | −0.8 | −1.7 | +0.4 | +2.5 |
| Ambiguous: round as breaks, baseline as bounces | −5.9 | −3.8 | −8.2 | −8.7 | −3.7 | −6.5 |
In ES, NQ, CL, and GC every row’s 95% interval lies below zero. In 6E every row’s does except the first of the last two, which bounds the gap at +0.4 (+0.2, +0.7). In ZN every row’s interval includes zero except those two bounds, which fall on opposite sides of it. The fixed-barrier row uses every year in ES and 6E, 2010 to 2017 in NQ, 13 years in CL, and 11 in GC, and the row after it uses the scaled X on exactly those years, so the two differ only in the barrier. The method notes describe the strata and day weighting.
The last two rows are worst cases, assigning every ambiguous touch whichever way moves the gap most. Even then the gap stays below zero in ES, NQ, CL, and GC; in 6E the favourable assignment would erase it. The 18 days of trades can’t say which way the ambiguous touches really lean. At ES’s round levels there were only 31 of them, of which 60% and 43% bounced in the two samples, against 51% and 49% at baseline levels, and estimates from so few are too imprecise to show a difference either way.
The barrier and the look-back move the result most. A touch after only five minutes away includes the levels price keeps coming back to, where the gap is about two points, and a level price hasn’t traded for two hours gives a larger one. The 15% barrier shrinks the gap, while a barrier fixed at 10 ticks keeps it, because 10 ticks is less than 5% of the daily range in most recent years, and the difference at round levels plays out over the first few ticks.
A comparison like this could turn up a gap wherever it looked, so we also tested placebo grids with the same spacing as each market’s three roundest tiers, shifted so that every level on them is a baseline price: for ES’s 10-point grid, the levels ending in 3.50, for example. We used every admissible shift, or 40 evenly spaced ones where there were more, 614 grids in all. Grids within two ticks of a real round level show gaps averaging between −0.2 points (6E) and −4.9 (GC), because they sit in the area where bounce rates are low (next section). Six or more ticks away, the 405 placebo grids average +0.3 points; in ES none falls below −0.8 and in CL none below −1.4, while in NQ and GC, where the low area is wider, a few reach −3.
Near the level, and approaching it
A test that starts at the round price can’t see approaches that stop short of it, so we looked at the area around the level two ways. The first scores every price near a round level exactly like a touch at the level itself. The chart pools every multiple of each market’s third-roundest step, so its zero point is the three round tiers together, as in the checks table.
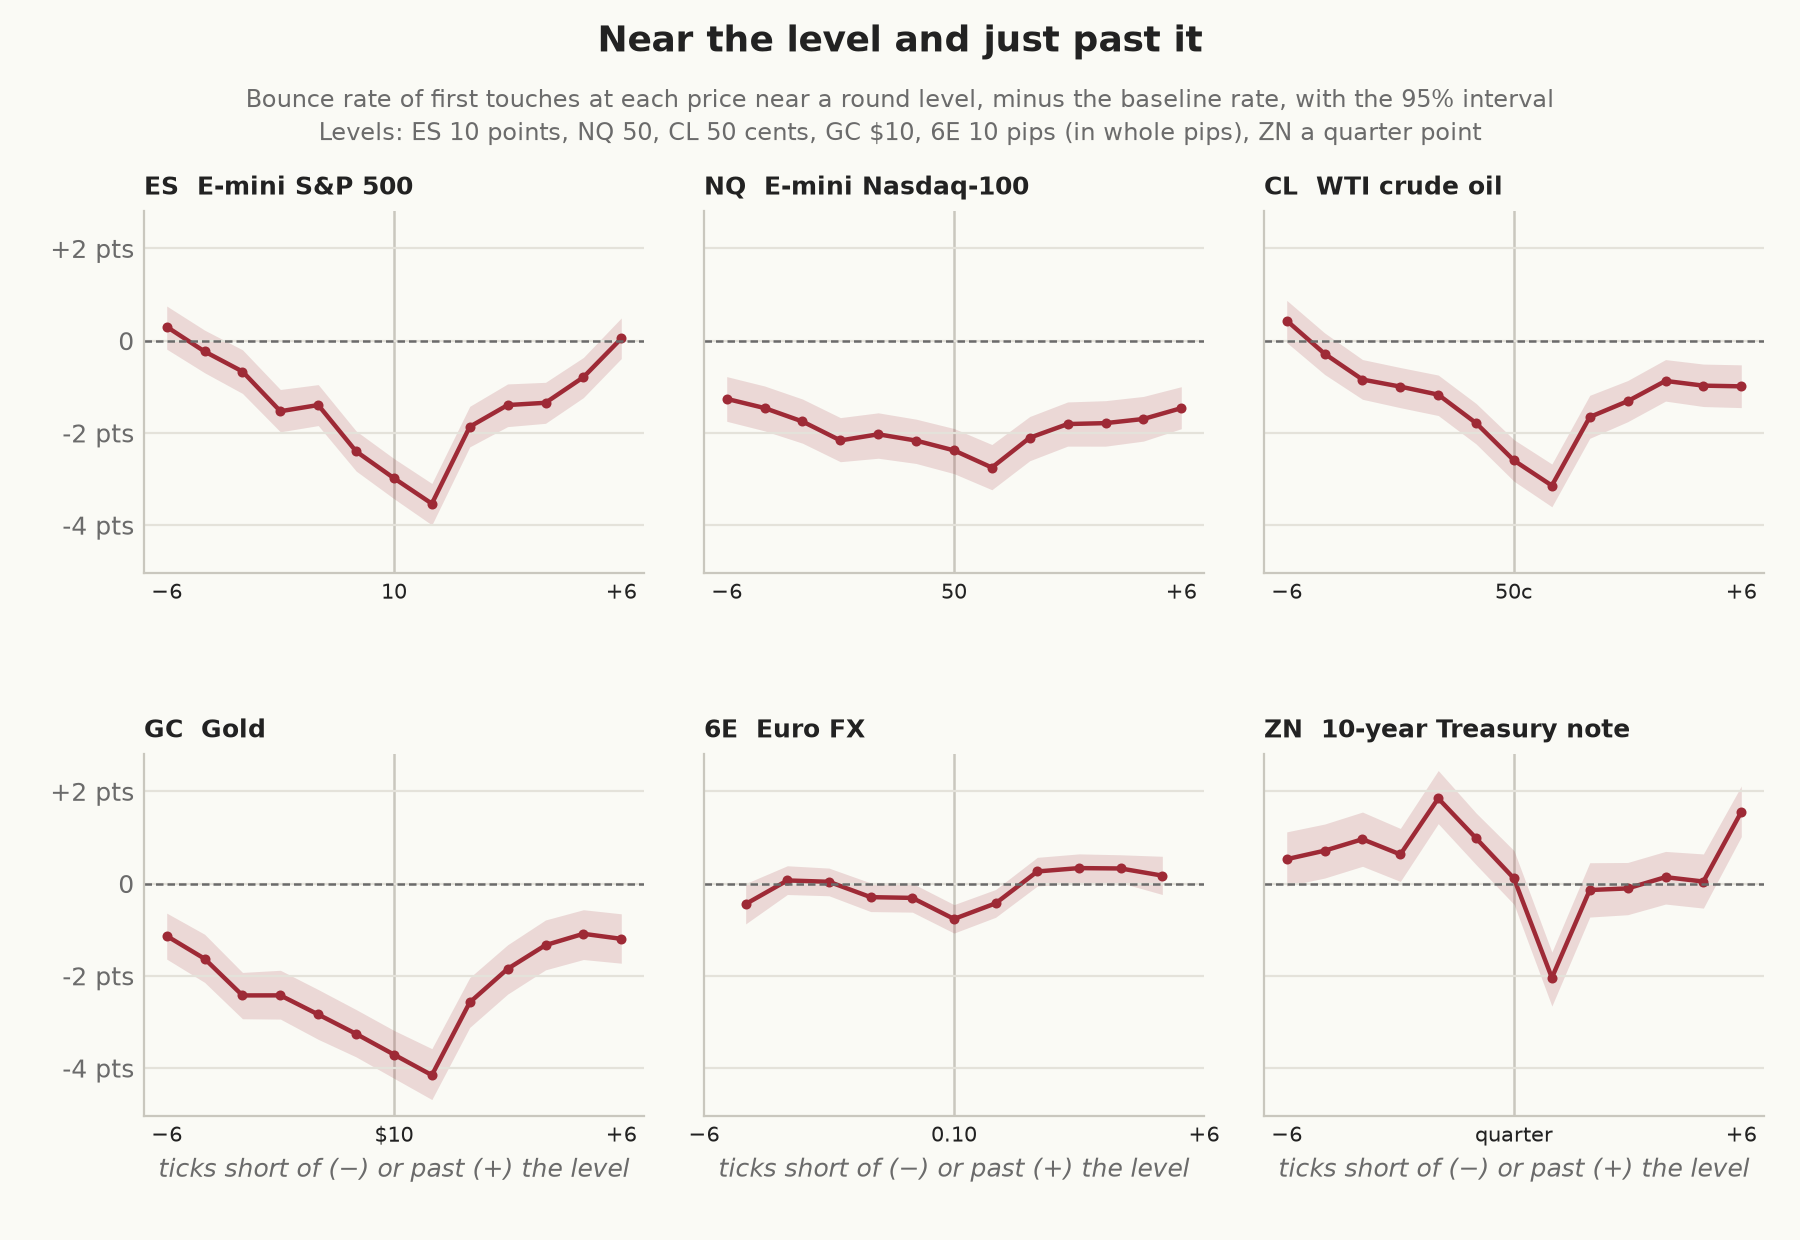
In ES, CL, GC, and NQ, touches a few ticks short of the level turn back less often than the baseline as well, and the shortfall grows as the level gets closer. It’s lowest one tick past the level: in ES, 50.4% of touches one tick past a 10-point level turned back, against 53.9% for the baseline, in CL 50.1% against 53.3% at 50-cent levels, and in GC 47.0% against 51.1% at $10 levels. Compared directly, the rate one tick past is below both the rate at the level and the rate two ticks past, in all four markets and ZN, though not in 6E. In ZN the pattern is the one the folklore describes: a few ticks short of its quarter points, touches turn back up to 1.8 points more often than its baseline, and one tick past, 2.0 points less often.
Each point on that chart still conditions on price having got to that price. The second view follows a common population instead: every approach that starts k ticks short of a level (the first touch of that price after 30 minutes away), until it either reaches the level or falls back k ticks. That’s another race between two barriers, each k ticks from the start and so 2k ticks apart. It has the same trouble with seconds whose order is unknown, and more of it, because the starting second is often a fast one: if its range already reaches the failure barrier, we can’t tell whether the fall came before the start or after. At 4 ticks out, between 17% and 65% of approaches in ES, NQ, CL, GC, and 6E started in an ambiguous second, so we’ve left that distance out. At 10 and 20 ticks:
| Market | Ambiguous starts, 10 and 20 ticks | 10 ticks out | 20 ticks out | 10 ticks, years with under 10% ambiguous |
|---|---|---|---|---|
| ES | 3.5%, 0.8% | −2.7 (−3.1, −2.2) | −0.9 (−1.2, −0.5) | −2.7 (every year) |
| NQ | 31%, 11% | −3.3 (−3.8, −2.7) | −2.1 (−2.5, −1.6) | −2.6 (2010 to 2017) |
| CL | 8.0%, 1.7% | −1.4 (−1.8, −1.0) | −1.1 (−1.4, −0.7) | −1.3 (13 years) |
| GC | 14%, 5.5% | −0.6 (−1.2, −0.1) | −1.0 (−1.5, −0.5) | −0.4 (−1.1, +0.4; 11 years) |
| 6E | 2.8%, 0.7% | −0.1 (−0.4, +0.1) | +0.2 (0.0, +0.4) | −0.1 (every year) |
| ZN | 0.1%, 0.0% | −0.9 (−1.7, −0.2) | −0.2 (−0.9, +0.5) | −0.9 (every year) |
Share of approaches that reached a round level before falling back k ticks, minus the share for baseline levels, in percentage points, with 95% intervals; approaches that started in an ambiguous second, or reached both barriers inside one later second, are left out. In ES, 45.0% of approaches starting 10 ticks (2.5 points) short of a round level reached it, against 47.7% for baseline levels.
Approaches heading for round levels reached them less often in ES, NQ, CL, and ZN from 10 ticks out, and in ES, NQ, CL, and GC from 20. Against targets on placebo grids at least six ticks from a real round level, the 10-tick gaps in ES, NQ, and CL, and CL’s 20-tick gap, are lower than every placebo, while GC’s 10-tick gap isn’t (a fifth of its placebos are as low).
The ambiguous starts are where this result could still fail. If every ambiguous start towards a round level had reached it and every one towards a baseline level had failed, the 10-tick gap in ES would be +1.0 points instead of −2.7. Where more starts are ambiguous the possible swing is larger. Only ZN, which has almost none, stays below zero under that assignment, and it brings ES at 20 ticks to about zero. The ambiguity rates are nearly the same for round and baseline targets. In the 18 days of trades, the ambiguous starts resolved at similar rates for both in ES, NQ, and GC, and less often for round targets in CL, but between 17 and 592 of them per sample at round levels is too few to rule the worst case out. On the approaches both methods resolved, bars and trades agreed on 97.8% to 100% of outcomes, but that says nothing about the excluded ones, so the approach result stays suggestive and depends on what they did.
Twenty ticks is five points in ES, so these approaches start about as far out as the trader selling at 6,995; a wider zone than that, or one measured in percent rather than ticks, we haven’t tested. Nor have we followed one population of approaches through both stages, to the level and then past it. The arrival rates here and the bounce rates in the previous section come from different populations with different stopping rules, so they can’t simply be multiplied. If the arrival result holds, the approaches that reach a round level may differ from the rest, perhaps by carrying more momentum, though nothing here measures that directly.
Where highs and lows stop
If stop orders cluster just past round numbers, highs and lows should rarely stop there, because any move that reaches the stops sets them off and goes further. We took every trade date’s high and low and every one-hour swing high and low (the highest high, or lowest low, in the 60 minutes either side) and counted how often each landed at each price near a round level.
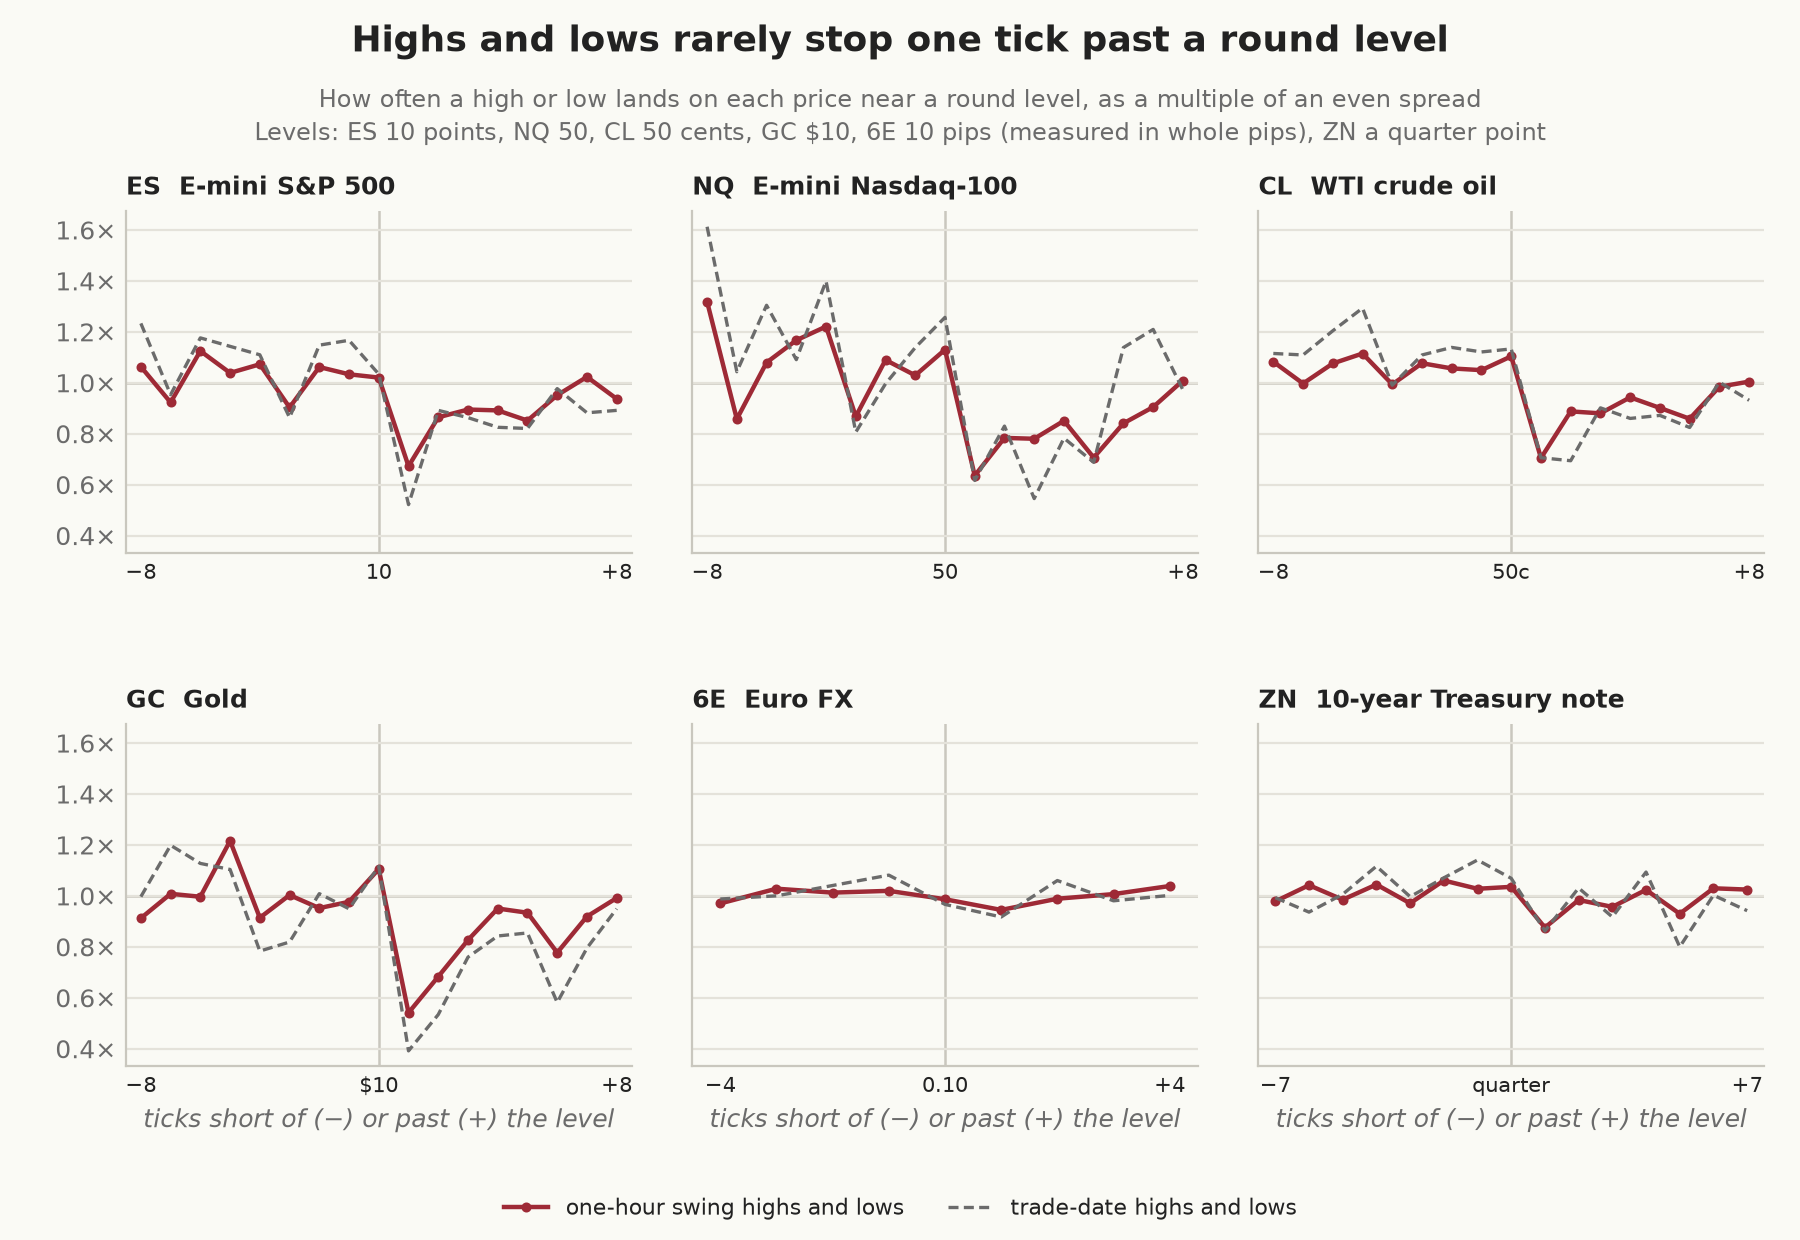
Up to and including the round level, highs and lows land about as often as an even spread would put them there, or a little more often, which would fit approaches that stall short. One tick past it the count drops away. One-hour swing highs and lows land a tick past a 10-point ES level 0.67 times as often as an even spread would predict, a tick past a 50-point NQ level 0.64 times, a 50-cent CL level 0.70 times, and a $10 GC level 0.54 times. For trade-date highs and lows the drop is deeper, to 0.52 in ES and 0.39 in GC, and at the roundest levels deeper again: 0.38 for ES’s 100-point levels and 0.24 for GC’s $100 levels. 6E (0.94 at 10-pip levels) and ZN (0.88 at quarter points) barely move.
Stop orders just past round numbers would leave this pattern, and so could other things. An even spread is only a rough benchmark, because price spends longer at some prices than others and the swing rule decides which highs count.
More size rests at some round prices
Stop orders don’t show in the book until they’re triggered, but take-profit orders and other resting limit orders do. Kavajecz and Odders-White (2004) found that support and resistance levels from common technical rules tend to coincide with peaks in limit-order depth. To see whether round prices draw extra size, we compared the size resting at round prices with the size at baseline prices the same number of ticks from the best bid or offer, since depth falls away from the inside and the book often has gaps.
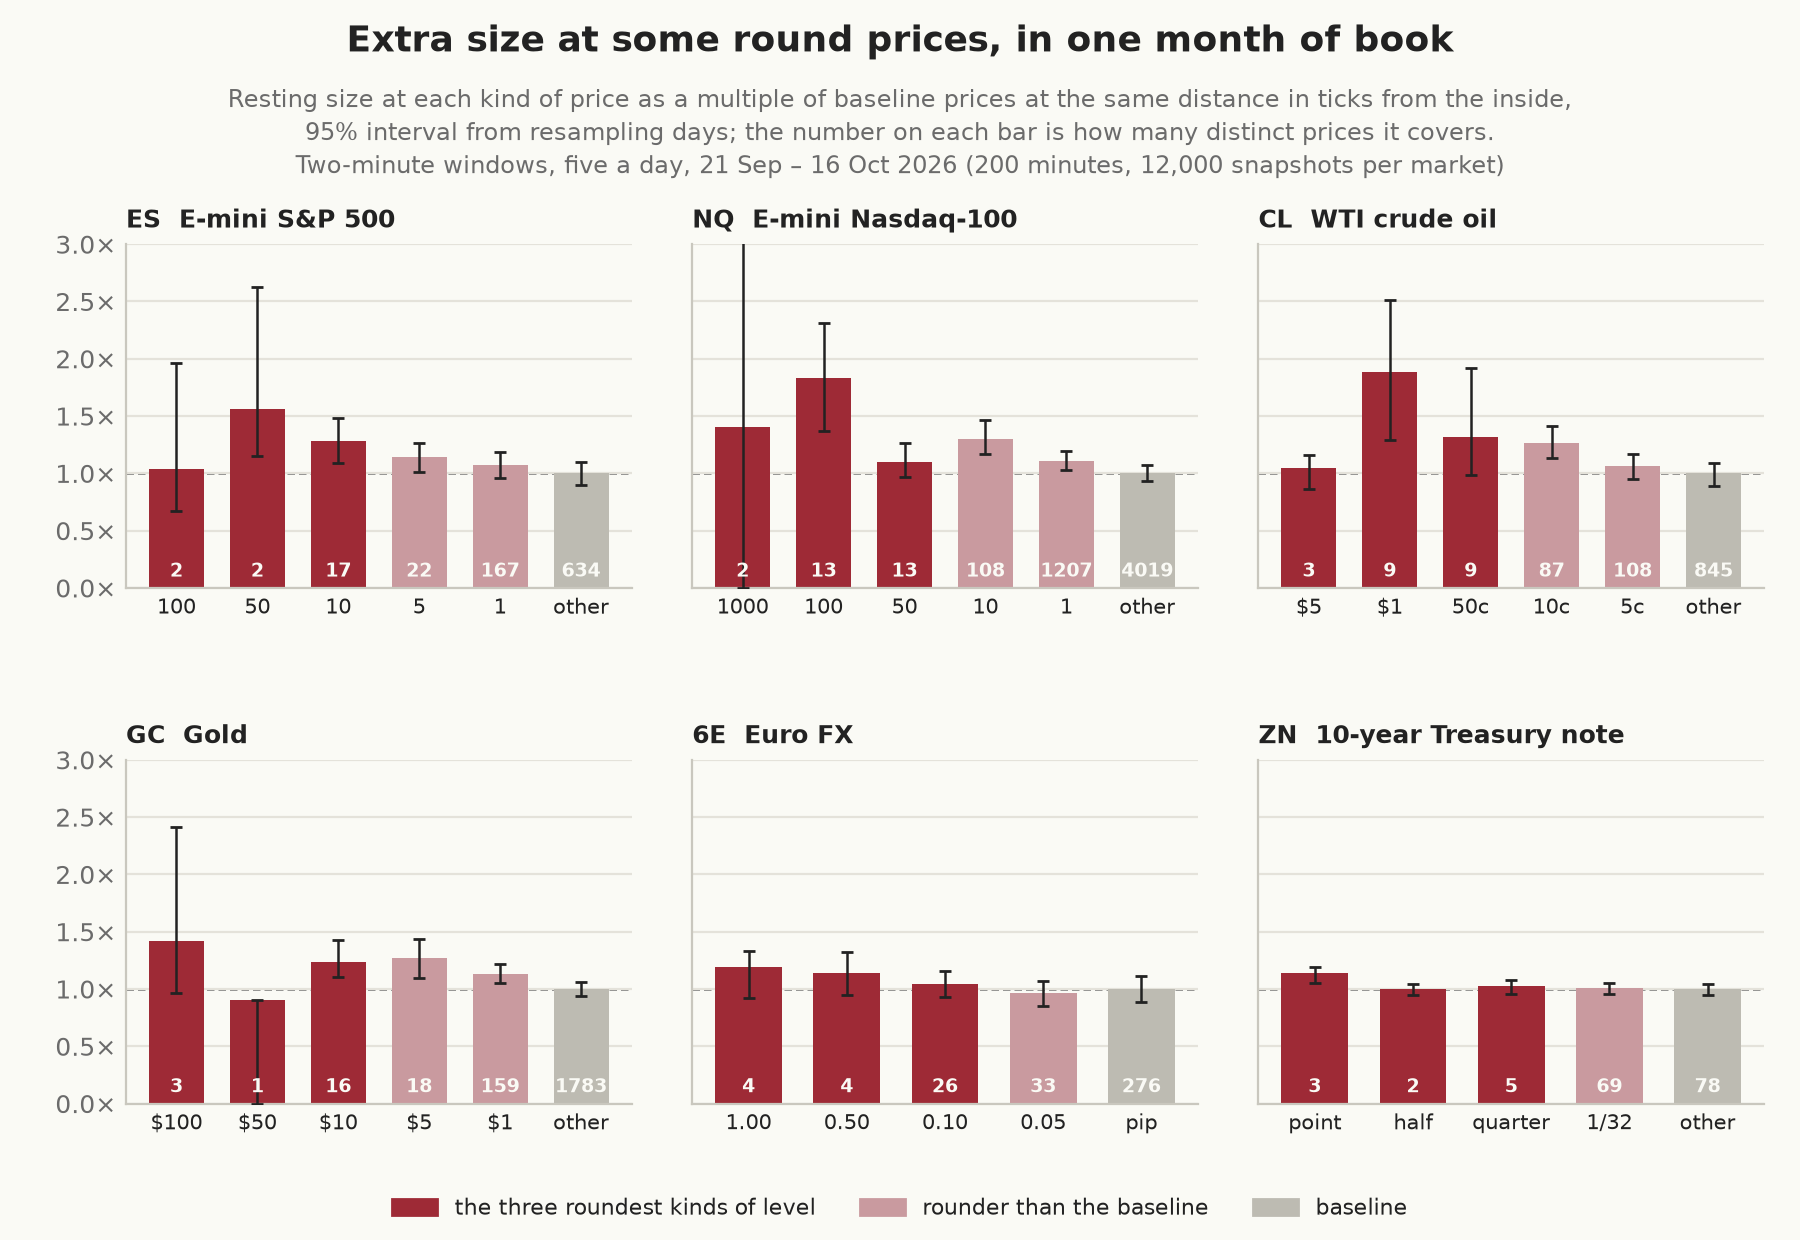
In a month, price came near only a handful of the roundest levels, so most bars rest on a few prices. Where the month covered enough different ones, round prices held more: 10-point ES prices 1.28 times the baseline size (17 prices), 100-point NQ prices 1.83 times (13 prices), whole-dollar CL prices 1.89 times (nine prices), and $10 GC prices 1.24 times (16 prices). Those four stay above 1 when we resample prices instead of days (ES 1.06 to 1.53, NQ 1.45 to 2.22, CL 1.20 to 2.33, and GC 1.09 to 1.47). Most of the individual prices in each held more than the baseline, from 13 of 17 in ES to all 13 in NQ. ZN’s whole points held 1.14 times as much, but there are only three of them, and 6E’s round prices and the roundest tiers elsewhere are within their intervals of the baseline. The order counts are higher too, by between 1.08 and 1.57 times, so more orders, as well as bigger ones, make up the extra size. The median snapshot is much closer to the baseline than the averages (1.09 at 10-point ES prices), so a good part of the difference comes from episodes of unusually large displayed depth.
One explanation would fit the extra size, the shortfall in arrivals, and the breaks through the level. If the extra size is take-profit and other selling orders, like the ones Osler found among a bank’s customer orders, it could turn some approaches back, and stop orders just past the level, which the book doesn’t show, could carry the ones that get through further, though we haven’t shown that either happens. Book data can’t say why anyone placed an order, though, displayed size can be cancelled before it trades, and one recent month can’t account for a pattern that goes back to 2010. Testing the idea would need the book before each touch matched with what happened after it.
The gap has narrowed, partly because X has grown
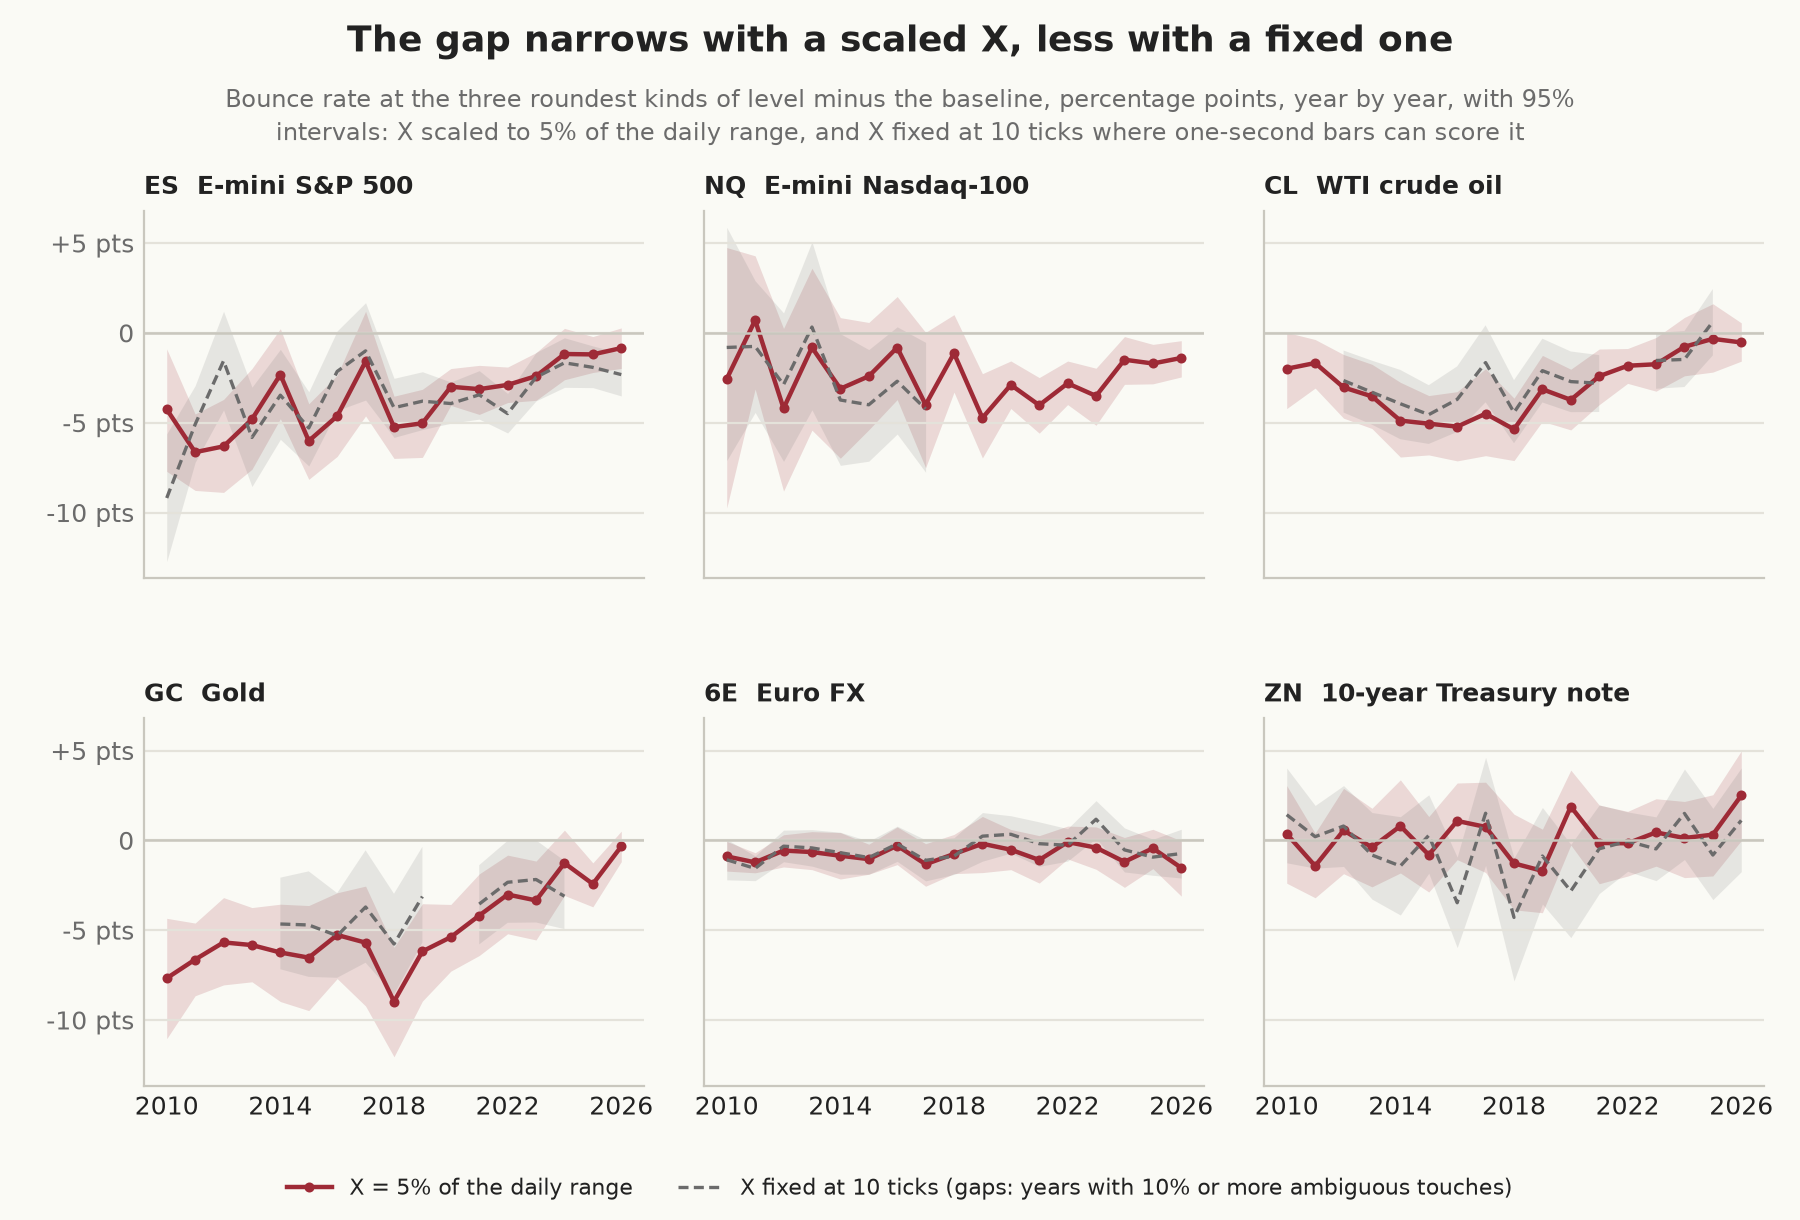
With X scaled to the daily range, the gap in ES was between about 5 and 7 percentage points in most years from 2010 to 2019, about 3 in 2020 to 2023, and close to 1 in 2024 to 2026. GC and CL followed nearly the same path, and part of that comes from X itself: ES’s X has grown from three ticks in 2012 to 16 now, and a move of a few ticks at a round level counts for less against a barrier 16 ticks away.
With X fixed at 10 ticks, the picture differs by market. ES’s gap was about 4 points from 2018 to 2022 and about 2 points from 2024 to 2026, so it has roughly halved. GC’s fixed-barrier gap was 4 to 7 points before 2018 and 2 to 3 points in 2022 to 2024; after that, too many of its touches are ambiguous at 10 ticks to score. CL’s gap has faded on both measures, to near zero in 2025. NQ’s ticks are now too small for one-second bars to score a fixed 10-tick barrier after 2017, and its scaled gap has moved around (between −1 and −5 points) more than it has trended. 6E’s has stayed at about 1 point throughout, and ZN’s near zero.
We don’t know why it has shrunk, though one possibility is the price level itself: when ES was at 1,400, a 10-point level was 0.7% from the next one, at 6,700 it’s 0.15%, and a day’s range now crosses several of them, so fewer people may single one out. Gold has more than tripled since 2016, and crude is about twice its 2016 to 2020 level, so the same could apply to both. Another is where stops now sit, about which we have no data.
What this means for stops and targets
All of this describes how price behaves around round levels, under one definition of a touch and one of an approach, and it says less about trading than it might seem to. In the idealised case of entering exactly at the level with exits X away on either side, the expected gain before costs is (2p − 1)X for a bounce rate p: 0.078X at an ordinary ES price and 0.023X at a 10-point level, both positive. So a fade at a round level has had less to work with than one at an ordinary price, before spread, slippage, and the chance that a resting order at the level fills mostly when the flow through it is strongest. Approaches also seem to reach round levels a little less often, but that result is less firm, and we haven’t tested whether it’s tradeable.
For stops and targets, the results raise questions that an execution study could answer. If stops do cluster just past round numbers, a stop placed there may fill well past its price when they trigger together; one-second bars can’t measure that, though the trades and the book could. A take-profit at a round number may sit behind more resting size than one a tick short of it, but moving it a tick gives up that tick on every fill, and whether the extra fills are worth it depends on queue position, which displayed size doesn’t tell you.
Caveats
These are front-month futures only, and a level counts as round by its digits alone, whether or not anyone published it as support or resistance. The touch rule favours approaches with some momentum, and the look-back rows show how much that matters. Outcomes are scored only inside the trade date, so touches late in the day have less time to resolve; at the wider X, between a third and three quarters of the touches in the last two hours never do. Leaving those hours out changes nothing, but we haven’t followed price into the next session. The tick replay we used covers the last year only; it doesn’t check the earlier years, when ticks were large relative to the barriers, or 6E’s prints before 2016, which are still unexplained. The approach test stops at 20 ticks out, and its ambiguous starts could still move it either way. The order-book sample is one month, in five short windows a day during US hours. With 28 tier comparisons at each X and the checks above, some of the smaller differences will be chance; the same sign across five markets makes chance an unlikely explanation for the main result, but it can’t rule out a bias that all the markets share.
Conclusion
In ES, NQ, CL, and GC, price that reaches a round level for the first time in a while goes through it more often than price that reaches an ordinary one, by 2.4 to 3.7 percentage points for the three roundest tiers together. It’s least likely of all to turn back one tick past the level, which is also where highs and lows rarely stop. The result held up under every check we ran, including the worst-case scoring of ambiguous seconds, though on a fixed barrier the gap in ES has roughly halved, from about 4 points in 2018 to 2022 to about 2 since 2024. 6E shows a smaller version, and ZN shows it only at whole points.
Approaches heading for round levels also reach them a little less often, which suggests the area around a round number holds some moves back before they get there, though that result depends on approaches we couldn’t score. Some round prices carry extra resting size in the book, too. As a trade, fading a round level has had a smaller edge than fading an ordinary price, and where stops and targets belong is a question for an execution study.
Method notes
Touches through each step, with X at 5% of the daily range:
| Market | Trade dates | First touches | Ambiguous touching second | Unresolved by the end of the date | Both ways in one later second | Scored | Round | Baseline |
|---|---|---|---|---|---|---|---|---|
| ES | 4,216 | 2,190,118 | 68,665 | 15,955 | 269 | 2,105,229 | 51,950 | 1,579,188 |
| NQ | 4,216 | 8,665,518 | 130,690 | 72,639 | 647 | 8,461,542 | 41,507 | 6,346,673 |
| CL | 4,213 | 2,885,233 | 174,104 | 25,564 | 1,147 | 2,684,418 | 53,322 | 2,148,016 |
| GC | 4,211 | 3,814,011 | 214,289 | 39,798 | 429 | 3,559,495 | 35,244 | 3,204,312 |
| 6E | 4,216 | 1,183,249 | 35,825 | 10,804 | 355 | 1,136,265 | 113,510 | 909,148 |
| ZN | 4,220 | 492,089 | 33,123 | 2,515 | 113 | 456,338 | 28,332 | 227,387 |
6E counts whole-pip levels only. Scored touches that are neither round nor baseline belong to the middle tiers.
Scoring. For a touch from below at level L in second i: the break is the first second j ≥ i whose high reaches L + X; the bounce is the first second j > i whose low reaches L − X. The touch is ambiguous if second i’s own low is at or below L − X. A touch from above is the mirror image, and both searches stop at the trade date’s last bar. An approach from below starting at S = L − k in second i succeeds at the first second j ≥ i whose high reaches L and fails at the first second j > i whose low reaches S − k. It’s ambiguous if second i’s own low is at or below S − k, and a later second that reaches both is a tie; ambiguous starts and ties are left out.
Price filter. For each bar, m is the median close of the 21 bars centred on it within the trade date (fewer at the ends of the date). Each date’s range of m is its highest m minus its lowest, and the threshold q is 15% of the median of that range over the date and the 19 before it, or 8 ticks if that’s larger. Each of the bar’s open, high, low, and close passes if it’s within q of m. If the close fails, the bar is dropped. Otherwise the new high is the largest passing value among the four and the new low the smallest, and an open that fails is replaced by the close. For example, the 6E bar at 14:42:23 UTC on 5 January 2012 had open 1.2802, high 1.2944, low 1.2802, and close 1.2802, with m at 1.2802 and q at 51 half-pips (0.0026); the high, 284 half-pips above m, fails, and the bar becomes 1.2802 for all four.
Intervals. Poisson bootstrap over trade dates: each date gets a weight drawn from a Poisson distribution with mean 1, and the rate or difference is recomputed with those weights, 2,000 times (300 for the strata); the interval runs from the 2.5th to the 97.5th percentile. For the Holm correction, each difference’s standard error is taken as the width of its 95% interval divided by 2 × 1.96, its p-value as the two-sided normal probability of the difference divided by that standard error, and the 28 p-values at each X are adjusted by Holm’s step-down method.
Day weighting. The mean, over the trade dates with both round and baseline touches, of each date’s round bounce rate minus its baseline rate.
Strata. Year, session (08:30 to 15:00 Chicago against the rest), tercile of the day’s X against its year’s median, tercile within the year of how far price had moved towards the level in the five minutes before the touch, and tercile within the year of the volume traded in those five minutes. The estimate is a Mantel-Haenszel weighted difference, the sum over strata of w(p_round − p_baseline) divided by the sum of w, with the same weight w = n_round × n_baseline / (n_round + n_baseline) for both groups. Strata missing either group are dropped; they held none of the round touches and under 0.2% of the baseline ones. Weighting each stratum by its share of round touches instead gives the same numbers to the third decimal, because round and baseline touches are spread across the strata in nearly the same proportions.
Placebo grids. For each of the three roundest tiers we took every shift s, from 0 up to the tier’s step, at which a level is a baseline price, or 40 shifts evenly spaced through that list where there were more. A grid is the baseline levels at s plus multiples of the step, and its gap is its bounce rate minus the rate of the other baseline levels.
Tick replay, X at 5% of the daily range. The paired columns use only touches that matched and that both methods resolved (neither ambiguous nor unresolved), so they share denominators; the end-to-end columns use every touch each method admits on those days.
| Market | Days | Paired touches (round, baseline) | Paired outcomes disagreeing (round, baseline) | Paired gap, bars | Paired gap, trades | End-to-end gap, bars | End-to-end gap, trades | Round touches admitted (bars, trades) |
|---|---|---|---|---|---|---|---|---|
| ES | 10 recent | 217, 6,394 | 0.0%, 0.0% | +1.6 | +1.6 | +1.7 | +1.9 | 220, 231 |
| ES | 8 volatile | 334, 10,013 | 0.3%, 0.2% | +2.8 | +2.7 | +2.9 | +1.9 | 334, 356 |
| NQ | 10 recent | 274, 41,877 | 0.0%, 0.1% | −1.3 | −1.2 | −1.1 | −1.4 | 275, 281 |
| NQ | 8 volatile | 311, 48,082 | 0.0%, 0.1% | −5.8 | −5.7 | −5.8 | −5.2 | 311, 319 |
| CL | 10 recent | 246, 9,753 | 0.0%, 0.0% | −0.8 | −0.8 | −0.8 | −0.5 | 246, 256 |
| CL | 8 volatile | 327, 12,657 | 0.6%, 0.7% | −2.2 | −1.9 | −1.8 | −1.2 | 336, 456 |
| GC | 10 recent | 248, 22,063 | 0.0%, 0.1% | +5.9 | +5.9 | +5.8 | +5.8 | 248, 250 |
| GC | 8 volatile | 645, 57,557 | 0.5%, 0.2% | −0.6 | −0.8 | −0.9 | +0.1 | 766, 890 |
| 6E | 10 recent | 211, 1,666 | 0.0%, 0.0% | +2.4 | +2.4 | +2.4 | +3.1 | 214, 222 |
| 6E | 8 volatile | 267, 2,094 | 0.0%, 0.1% | +0.2 | +0.1 | +0.3 | +0.7 | 268, 278 |
| ZN | 10 recent | 90, 632 | 0.0%, 0.0% | +7.5 | +7.5 | +7.7 | +7.6 | 91, 95 |
| ZN | 8 volatile | 54, 484 | 0.0%, 0.0% | +5.5 | +5.5 | +5.5 | +3.5 | 54, 61 |
Gaps in percentage points. Eighteen days are far too few to estimate the gap itself, and several of these intervals span ten points or more; the table checks the measurement, not the effect. The paired gaps can differ by no more than the two disagreement rates added together, and they don’t. The end-to-end gaps differ more because each method admits different touches, mostly the ones the bars set aside as ambiguous. We didn’t establish why fewer GC touches matched on the volatile days. The volatile dates were 29 and 30 January, 2, 3, 6, 9, and 23 March, and 5 June 2026, chosen by range against the trailing median, averaged over the six markets.
References
- Bhattacharya, U., Holden, C. W., and Jacobsen, S. (2012), “Penny Wise, Dollar Foolish: Buy-Sell Imbalances On and Around Round Numbers”, Management Science 58(2), 413–431, https://papers.ssrn.com/abstract=1569922.
- Donaldson, R. G., and Kim, H. Y. (1993), “Price Barriers in the Dow Jones Industrial Average”, Journal of Financial and Quantitative Analysis 28(3), 313–330, https://ideas.repec.org/a/cup/jfinqa/v28y1993i03p313-330_00.html.
- Kavajecz, K. A., and Odders-White, E. R. (2004), “Technical Analysis and Liquidity Provision”, Review of Financial Studies 17(4), 1043–1071, https://ideas.repec.org/a/oup/rfinst/v17y2004i4p1043-1071.html.
- Osler, C. L. (2003), “Currency Orders and Exchange Rate Dynamics: An Explanation for the Predictive Success of Technical Analysis”, Journal of Finance 58(5), 1791–1819; working-paper version, Federal Reserve Bank of New York Staff Report 125, https://www.newyorkfed.org/medialibrary/media/research/staff_reports/sr125.pdf.
- Osler, C. L. (2005), “Stop-Loss Orders and Price Cascades in Currency Markets”, Journal of International Money and Finance 24(2), 219–241; working-paper version, Federal Reserve Bank of New York Staff Report 150, https://www.newyorkfed.org/medialibrary/media/research/staff_reports/sr150.pdf.
- Databento, MBP-10 and trades schemas, CME Globex MDP 3.0 dataset, https://databento.com/docs.