Rolling your own futures contracts
A chart of ES is a chain of contracts
A chart of the E-mini S&P 500 going back to 2010 looks like one instrument with a long history, but it’s 67 quarterly contracts laid end to end, each of which was listed, traded heavily for about three months, and then left to expire. Somebody decided which contract to show on each day, when to move to the next one, and what to do about the difference in price between the two, and those decisions are in every backtest that uses the chart.
If you buy a continuous series from a data vendor, you inherit the vendor’s decisions, usually without being told what they are. Rolling your own means making them yourself, which has three advantages. The series and your live positions can follow the same rule, so a backtest holds the contract you’d actually hold. You can rebuild the series from the dated contracts and explain any number in it. And when a vendor quietly changes its method, or breaks it, your history stays where it was.
The price is that every decision below becomes yours, and so do the bugs. This post works through them with CME data from our archive, which holds every dated contract since June 2010, with the exchange’s settlement prices.1 The examples come from six markets: ES, crude oil (CL), natural gas (NG), gold (GC), the 10-year note (ZN), and corn (ZC). It follows on from Why market data is harder than you think, which showed one session of ES in 2014 opening at 1967.50 in the contract, 2352.25 in a vendor’s adjusted series, and 2593.50 in ours.
Panama or ratio
I’ll start with the last decision, because it’s the one that most changes what the history looks like. When you move from an expiring contract to the next one, the two have different prices, and the difference is mostly the cost of carrying the asset from one delivery date to the next (interest and storage, less any dividends or coupons). If you simply join the two price series, then the chart jumps at every roll, and a strategy will read each jump as a move it could have traded.
There are two common ways to remove the jumps. Panama adjustment (named after the canal, because it closes the gap) adds the gap to every earlier price, so a point move before the roll stays the same number of points. Ratio adjustment multiplies every earlier price by the ratio of the two contracts' prices, so a percentage move before the roll stays the same percentage. Each roll adds another constant or another factor to everything before it, and over 16 years they add up.
The chart below applies the two methods to the same 16 years of crude oil and natural gas. The roll dates and the gap at each roll are identical in all three lines, and only the way the gaps are carried back differs.
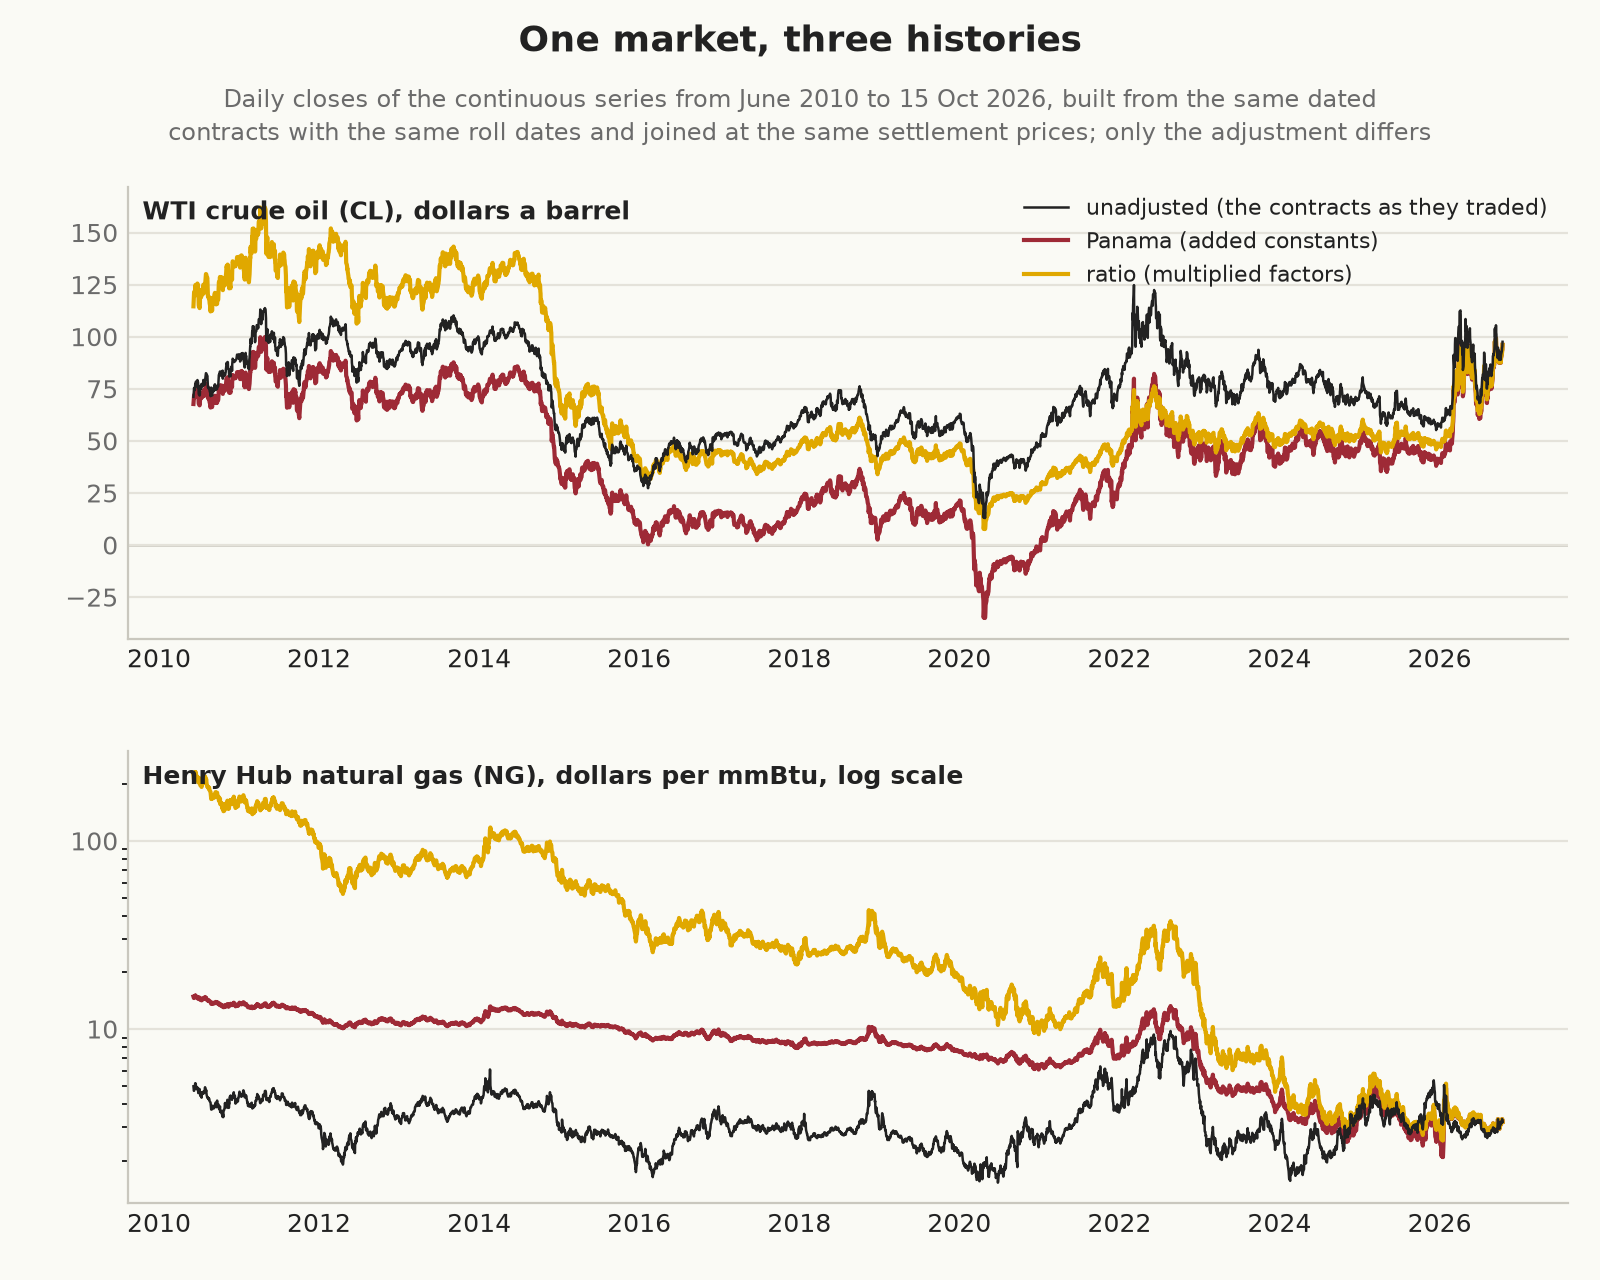
The differences are big enough to change a backtest:
- The Panama series for crude oil is below zero on 215 trade dates from 6 March 2020, with a low of −35.02 on 27 April 2020, although no contract it held ever traded below zero. (On 20 April 2020, when the May contract settled at −37.63, the series was already holding June, as we’ll see.) A strategy that takes logs or divides by price fails on those dates, and no percentage stop can handle a negative price.
- The ratio series for natural gas starts at 224.09 in June 2010, when the contract that traded was at 4.96. No gas contract has ever cost $224, but the ratio series gets one kind of return right. It’s the return of a fully funded long, rolled every month at the settlement prices, whose number of contracts is reset at each roll to keep the same amount of money exposed, with no interest on the cash. On that basis it lost 98.6% from June 2010 to October 2026, while the front-month price fell by 35%. One contract held throughout lost $116,700, the Panama series’ fall of 11.67 times the contract’s multiplier of 10,000.
- For ES, the Panama series puts June 2010 at 1706.60 and the ratio series at 1089.85, against 1049.25 in the contract.
Volatility shows the trade-off most clearly, and almost every method of sizing a position uses it. A daily percentage return from a ratio series is the held contract’s own return, so it’s the right input, whereas a daily percentage return from a Panama series divides the right point move by the wrong price. In 2011, ES had an annualised volatility of 24.1% from the ratio series and 15.4% from the Panama series. The usual sizing rule holds (capital × target volatility) ÷ (volatility × price × multiplier) contracts. A strategy that took the volatility from the Panama series and the price from the contract would have held 24.1 ÷ 15.4 times as many contracts as it meant to, or about 56% more. If it took the Panama price as well, the two errors would largely cancel, because volatility times price is the volatility in points, which Panama keeps. For natural gas the Panama figure for 2011 was 10.4%, against 33.2%, and for crude oil in 2015 it was 83.9%, against 42.6%, because by then the Panama price was close to zero.
Which one is right depends on what you calculate. A Panama series keeps point moves within each contract, and a point move times the contract multiplier is the dollar profit or loss on one contract. Across a roll, the series gives the profit or loss of a position rolled at exactly the two settlement prices, whereas a real roll trades at some other spread. So Panama suits anything measured in points or dollars per contract: a stop that’s so many points away, a breakout of the last 20 days’ range, or the profit and loss of a fixed number of contracts. A ratio series keeps percentage moves, which suits returns, volatility, and comparisons between markets. It can’t cope with a price at or below zero, because no factor turns a positive price into a negative one, so a ratio series through April 2020 in crude oil needs special handling, and a good implementation stops with an error instead of inventing a factor.
Most practitioners who build their own series keep the unadjusted price of the held contract alongside the adjusted one, and I think that’s the best arrangement. A percentage return is then the Panama point move divided by the previous day’s unadjusted price, which is the contract’s own return, and the Panama series is still there for anything in points.2 You’ll need the unadjusted price anyway for anything that touches the market, such as an order, a stop, or a fill.
There are two other ways to build a long series, both of which can be useful. An unadjusted chain (a “continuation”, in Peter Brandt’s term) keeps the real prices and leaves the jumps in, which chartists such as Brandt prefer, because every price on the chart is one that traded. Jack Schwager has long argued for adjusted series, because no one could have traded the jumps.3 A constant-maturity series, such as CSI’s Perpetual Contract, blends two contracts to keep a fixed time to expiry, which smooths the roll away altogether, and you could hold the same exposure with a weighted pair of contracts. Once the weights shift, though, the blended price’s changes are no longer that pair’s profit or loss, so it’s a series for research on the term structure, and a backtest of trades on it needs its own accounting.
The four questions every roll answers
Whatever the adjustment, every roll comes down to four questions, and a continuous series is only as good as the answers:
- Which contract do I hold: the front contract, or a later one?
- On which trade date does the next contract take over?
- At what instant on that date?
- How do I measure the gap between the two prices?
Cost matters too, but that’s a question about trading the roll, so it comes later.
When to roll
Rules for the roll date fall into two broad families, and the first follows liquidity: roll when the next contract’s volume (or open interest) overtakes the current one’s. It’s appealing, because it holds whichever contract the market is trading, but it has three problems. Two contracts with similar volume can cross back and forth, so the rule needs a filter (we use three consecutive days). The roll date can’t be known in advance, so a live trader can’t plan for it. And it’s easy to build in look-ahead, because a day’s official volume and open interest are published after the close, open interest usually on the next morning, so a backtest that rolls on the day of the crossover has used numbers that weren’t available until later.
Databento’s volume-ranked continuous symbols avoid the look-ahead by ranking contracts on the previous day’s volume, which means they switch a day after the crossover.4 Even CME is inconsistent about the signal. One of its education pages tells traders to watch volume on the Thursday of roll week and switch when the new contract trades more. Its published roll calendar for the equity index futures said, until 2022, that “the trading floor convention is to roll … eight calendar days before the contract expires”, and has said since 2023 that the roll date is “the Monday prior to the third Friday of the expiration month”.5
The second family is a calendar rule: roll a fixed number of business days before the last trading day, the first notice day, or another date fixed by the contract’s specification. A calendar rule needs no prices at all, so you can print next year’s roll dates today, and a backtest that uses it never sees a day’s volume before it’s published. Its weakness is that liquidity moves over time and the rule stays put. A calendar rule that a lot of money follows is also predictable, and other traders can trade against it. The S&P GSCI commodity index rolls a fifth of its positions on each of the fifth to ninth business days of the month. Yiqun Mou found that the price pressure from that roll was large enough to profit from by trading ahead of it.6 His sample ends in 2010, and I don’t know how much of the effect is left now that the roll window is so well known, but I’d still rather not roll a commodity in the middle of the index funds’ week.
We use a calendar rule for each market, fitted to where the volume crossover was over 2016 to 2026, and use volume only to check it. Choosing the rules that way is a form of look-ahead, because over 2010 to 2015 they (and the months we let gold and soybeans hold, chosen the same way) use liquidity patterns that weren’t known until later. Since 2016, their agreement with the crossover only measures how well they fit the data they came from. Our series are therefore built under rules calibrated in October 2026, and a backtest that’s meant to use only what was known at the time would need rules and eligible months set from the volume available on each date.
Each month a monitor measures the crossover of the last eight rolls against the rule, and flags any market where the two have drifted more than two business days apart. For ES, the crossover fell within one business day of the rule’s date on every roll since 2016, and for crude oil and natural gas on 98% of them, but the check still earns its keep. RBOB gasoline’s crossover drifted from about 8.5 business days before the last trading day in 2016 to 2022 to 11 or 12 in 2023 to 2026, so we moved its roll from nine days before to 11.
The next chart shows the outgoing contract’s share of the two contracts’ volume on each trade date around our roll date, in each market, over every roll since 2016.
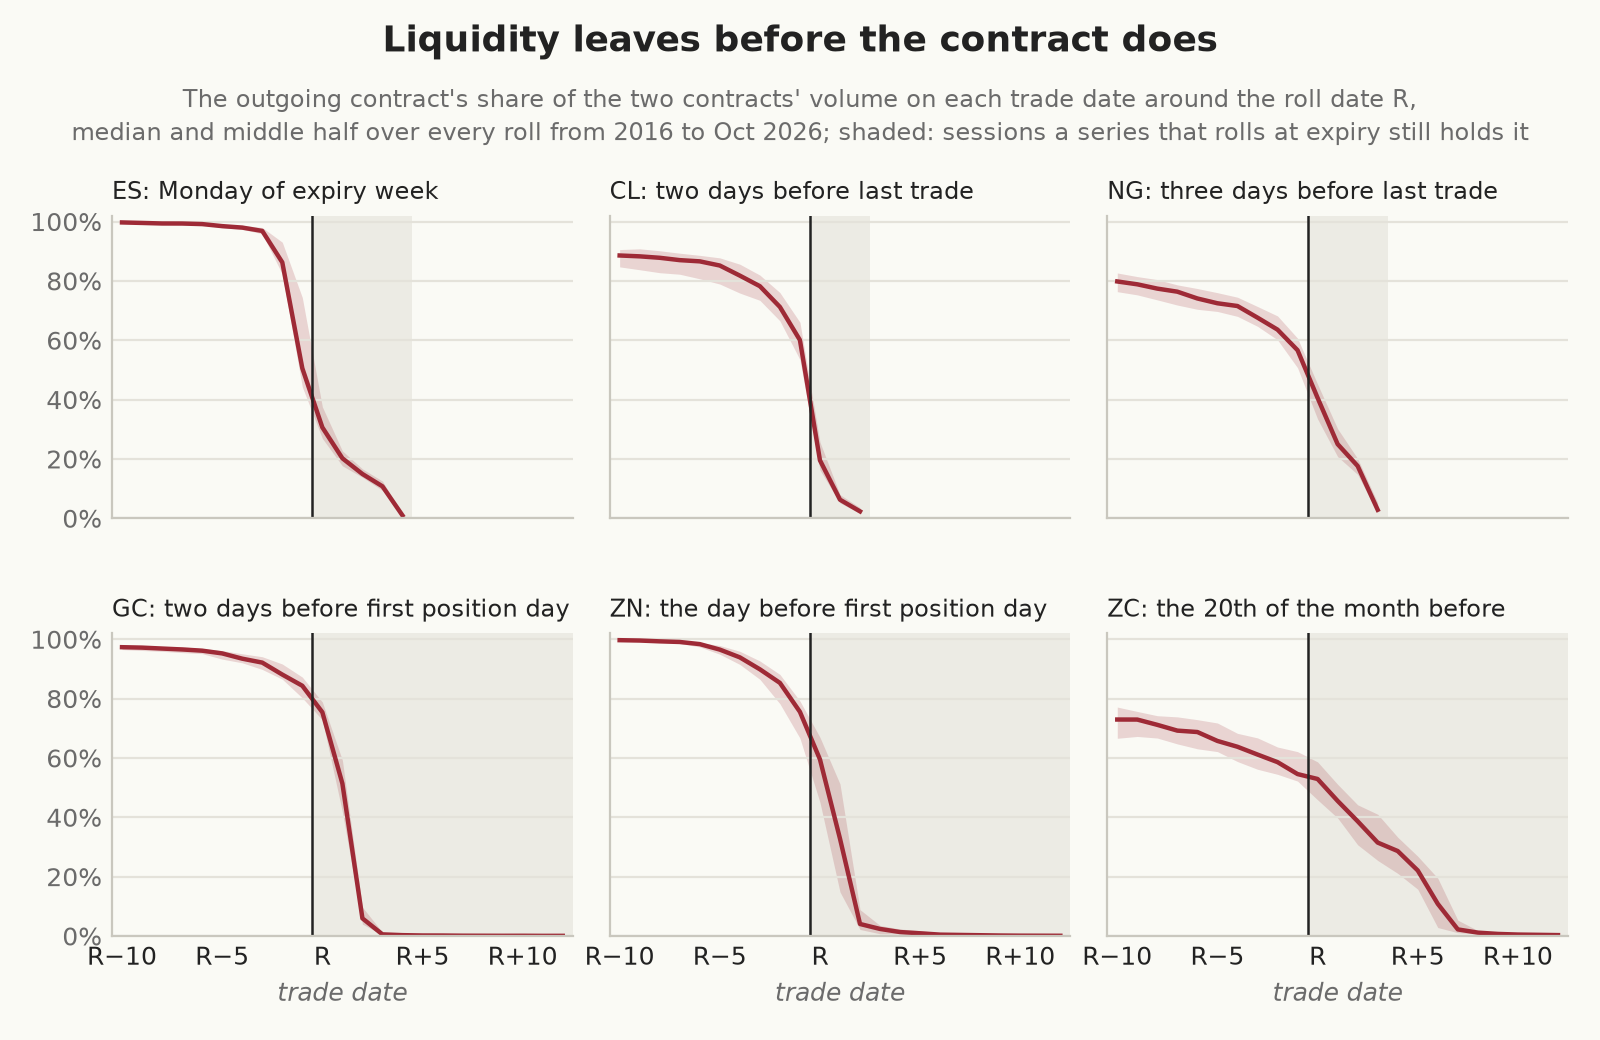
On the Friday before an ES roll (our R−1), the outgoing contract still has a median 51% of the volume. On the Monday it has 31%, by the Thursday 11%, and on the morning of its expiry about 1%. Crude oil falls faster, from 60% on the last day we hold it to 19% the next day. The three physically delivered markets at the bottom of the chart show a second reason for the roll date, which is delivery. Gold, the 10-year note, and corn all roll before the first day on which a long can be assigned a delivery notice, and that’s weeks before the contract’s last trading day. A series that held them until the last trading day would sit for 17 to 23 more trade dates in a contract with almost no volume, through a delivery period that no retail broker would let you stay in.
Our first set of calendar rules came from a vendor’s published roll sheet, and we misread it. We took a “12” for ES to mean 12 business days before expiry, when in that vendor’s notation a plain number is a calendar day of the contract month and a starred one is a day of the previous month. Nothing looked wrong, because every roll still landed on a sensible-looking date, and our ES series rolled more than a week early until we compared the roll dates with the volume.
Which contract to hold
In October 2024 our gold series held a contract that didn’t trade at all on two of the days it held it. Gold lists a contract for every month, but almost all its volume goes through February, April, June, August, and December, and we’d let the rule roll through every listed month. The fix was to measure, for every market over 2016 to 2026, which months had ever been the most active contract, and roll only through those. October gold had been the most active on 88 days in 2019 to 2023 and on none since 2024. Soybeans now roll through January, March, May, July, and November, because September never was.
In some markets the front contract is the wrong one to hold. In 30-day Fed funds futures (ZQ) and three-month SOFR futures (SR3), the front contract is close to a fixing of rates that are already known, and the trading is in the next contract or the one after. We hold the second contract in both, and in ZQ we move to the next one 10 business days before the front contract’s last trade, which makes the held contract the most active one on 45% of trade dates, against 37% for the rule it replaced.
You don’t have to hold every contract you could, either. Robert Carver’s open-source trading system, pysystemtrade, keeps two lists for each market, the contracts it can get prices for and the ones it will hold. In crude oil and corn it holds only the December contract, rolling into the next December weeks ahead.7 In crude oil that’s one roll a year instead of 12, at the cost of holding a contract further from expiry, which can be less liquid and moves differently from the front month. We haven’t tried it ourselves, though for anyone rolling by hand it’s tempting.
Smaller contracts aren’t always on the parent’s timetable. Micro WTI (MCL) and E-mini natural gas (QG) both expire a business day before CL and NG, so a rule copied from the parent contract rolls a day late, into a contract that’s about to stop trading.
Expiry dates should come from the exchange’s own definition of each contract, and a formula will eventually get one wrong. The June 2026 ES contract expired on Thursday 18 June, because Friday 19 June was the Juneteenth holiday. Our ES rule is anchored to the scheduled third Friday, so the holiday didn’t move the roll, but a rule that counted back from the real expiry would have rolled a day earlier than in every other quarter. Holidays catch out business-day counts in a subtler way, too. On Martin Luther King Day, Presidents’ Day, Thanksgiving, and a few others, CME’s electronic market trades a short session but its clearing house settles nothing, so those days have no settlement prices and can’t be the day before a roll.
The instant of the roll
A roll date still leaves a choice of instant. We hold the outgoing contract through the last bar of trade date R−1 and the incoming one from the first instant that trade date R trades. For most CME markets that’s the evening reopen before R, so a Monday roll in ES happens at 17:00 Chicago time on the Sunday. Livestock rolls at the morning open, because that’s when its trading day starts, and CME’s crypto futures, which have traded almost around the clock since 29 May 2026, roll in the daily halt at 16:00.
A bar that straddles a roll mixes two prices that differ by the gap, so its range, volume, and close are all wrong. Putting the switch on a trade-date boundary means that no intraday or daily bar does that, although a weekly or monthly bar still can, with its open from one contract and its close from the other. The boundary itself moves, though: in 2010 the ES trading day began at 15:30 Chicago time, and in UTC the same 17:00 reopen is 22:00 in summer and 23:00 in winter, so the cut has to come from a dated session calendar, never from a fixed time of day.
Measuring the gap
The gap should be measured from two prices taken at the same moment, and the best pair is the two contracts’ settlement prices on R−1. The exchange sets them for every listed contract in the same window, so even a thinly traded contract has a price that’s simultaneous with the other. A deferred contract’s last trade, on the other hand, can be hours older than the front’s, and a gap measured from last trades then includes whatever the market did in between.
In the June 2026 ES roll, CME settled the June contract at 7435.00 and the September contract at 7497.50 on Friday 12 June, so the gap was +62.50 points for Panama, or a factor of 1.008406 for ratio. The June contract’s last trade that day was 7436.25, so a gap measured from the last trades would have been off by more than a point. FirstRate Data’s documentation describes something worse: it measures the gap from the final close of the expiring contract to the opening price of the new one, so whatever the market did overnight goes into the adjustment and disappears from every earlier price.8
Across our six markets, the median gap is 7.5 points in ES, 39 cents in crude oil, and 9 cents in corn. The largest come when carry changes suddenly: 70.25 points in ES in December 2024, and 111.75 cents in corn in June 2013, when the July contract was old crop from the 2012 drought and the December contract was the new crop. Every one of the 670 seams in these six markets was measured from settlement prices. When a settlement is missing, we fall back to the two contracts’ prices at the minute of the settlement window, then to the last minute in which both traded, and then to the outgoing contract’s last price and the incoming one’s first. Each fallback is flagged in the series, and a gap that none of them can measure ends the series at that roll, because a guess would put a wrong number into every earlier price. The last fallback brings back the problem of prices taken at different times, and the flag only records it, so a seam measured that way should be kept out of anything that uses returns until someone has checked it.
Settlement data turned out to be the hardest part of all this, and we found the worst of it while writing this post. Our daily read of the May 2020 crude oil contract, with settlement prices as closes, showed Friday 17 April at −37.63. That was Monday 20 April’s settlement, and Friday’s had been 18.27. The exchange’s feed had sent a final settlement labelled 17 April, with Monday’s price, on the Monday evening, and that read path took the latest record for each date, which is the obvious way to write it. Our session bars got it right only because they accept a settlement published on its own trade date.
So we went through every settlement record in our CME data, all 6.13 million of them, grouped by contract and trade date. In 20,496 of those groups a later record carried a different price from the one published on the day. About 18,700 were Friday settlements sent again on the Sunday, usually rounded to the contract’s trading tick: the March 2016 E-mini euro contract (E7) settled at 1.09245 on Friday 15 January 2016, and the Sunday re-send said 1.0925. Another 838 re-sends carried a price of zero, which a rule that takes the latest record would happily turn into a close, and about 1,700 came on a Monday, the crude oil record among them.
Holidays add a third kind of record. On 3 July 2015 ES traded until noon and didn’t settle, and the record the exchange posted for that date repeated Thursday’s settlement of 2068.75; on Martin Luther King Day 2016 the euro contract’s placeholder repeated Friday’s 1.09245. Our daily read used to show those placeholders as settlements. Like the session bars, it now takes the figure published on the trade date, and on a day with none it leaves the settlement blank and falls back to the last trade. In 2024, 42 of ES’s 1,749 session bars had no settlement.
The roll schedule chooses its settlements by a different rule again: the latest record received, and where one publication carries two prices, the one on the contract’s tick. That rule took 65 seam prices from a Sunday re-send, in ES, E-mini natural gas, and one lean hogs roll, and each was the on-tick price the rule is meant to prefer, so no seam changed. In ES the difference is visible, though: until mid-2016, the Friday settlement for ES was often published to a tenth of a point, off ES’s own 0.25-point tick (1089.20 for the June 2010 contract on 11 June 2010), and the Sunday re-send rounded it to 1089.25. On 26 of the 132 prices behind the 66 ES seams, the seam and the settlement on the session bar beside it differ by 0.05 to 0.10 points, and for the June 2014 roll the Sunday re-send is the only record there is. That’s too small to matter to a strategy, but two parts of the same archive now answer “what did ES settle at that Friday?” differently, and anyone reconciling one against the other will trip over it.
The settlement a trader could have seen on the day belongs in a backtest of decisions made then, and the corrected one published later belongs in an accurate history. Only the time each record was published can tell them apart, and preferring the on-tick price doesn’t say which one was available on the day.
Where the history is anchored
An adjusted history has to be anchored somewhere, and the usual choice is the most recent contract, so that today’s prices are real and the past moves, which means that every roll changes every earlier price. The ES session on 10 July 2014 closed at 1957.50 in the September 2014 contract. In our Panama series, read on 1 June 2026, it closed at 2583.50, and read on 15 October 2026, after the June and September rolls had added 62.50 and 67.75 points, it closed at 2713.75. In the ratio series it’s 2180.06, and in a Panama series that ended in July 2014 it’s 1957.50 again.
So if you rerun a backtest after a roll, some of its inputs have changed. Adding the same constant to every earlier price leaves point differences alone, and a moving-average crossover in points gives the same signals. But anything that divides by the price (a percentage stop, a volatility estimate, or a position size) changes a little every quarter, and in a market such as crude oil, where the constant has pushed the price through zero, it changes a lot. A ratio series has the mirror-image problem with anything measured in points.
The honest anchor for a backtest is the decision time: on each day, the strategy sees the series as it would have been adjusted that day, with no later roll in it. That means recomputing the history as the backtest walks forward, which is slow, and for a strategy whose rules are all in points it changes nothing. It matters when the strategy divides by the price, and it matters a great deal in crude oil.
The trouble with somebody else’s roll
A vendor’s continuous file hides all of this. You get one price a day and, at best, a paragraph describing the method, and some vendors seem to have chosen rules that are simple for them to run, whether or not they’re any use to a trader. Here’s what some of the better-known sources say they do, in their own words where they say anything:
| Source | When it rolls | Adjustment |
|---|---|---|
Databento c series | at the nearest expiry | none |
Databento v and n series | by the previous day’s volume or open interest | none |
TradeStation continuous symbols (such as @ES) | a fixed point for each market, “usually determined by the open interest”, such as six trading days before expiry for the S&P 500; the points for other markets aren’t published | additive, back to the start of the data |
TradingView continuous symbols (ES1! for the front contract, ES2! for the next) | one help page: when the front month expires; another: a fixed number of days before expiry, set from average volume | additive for CME since November 2022, off by default |
| Interactive Brokers continuous futures | not stated in general; historical data only | ratio, in the TWS guide’s example |
| Norgate | the business day before the last trade (cash-settled) or before first notice (deliverable) | additive |
| Pinnacle Data | a fixed day for each market, such as the 11th of the month before delivery for crude oil | your choice of back-adjusted (which Pinnacle calls “highly recommended”), none, or ratio |
| FirstRate Data | “a custom set of rules to trigger the roll prior to expiry” | none, additive, or ratio |
| CSI Data (Unfair Advantage) | whatever you set: days before expiry or delivery, or volume and open interest; no default stated | your choice of eight constructions, including back-adjusted, ratio, and “Perpetual” blends |
| Quandl’s CHRIS (now discontinued) | “the roll dates are simply the last trading dates” | none: “end-to-end concatenation” |
The cheapest rule to run, rolling at expiry, is the default in several of them, and the documentation is often too thin to rebuild the series from. TradingView’s two help pages describe different rules, and the one that gives the fixed offset says that its gold series switched on 28 July 2022 for a contract that expired on 29 August.
TradeStation publishes its rule for the S&P 500 and not for anything else, so traders have worked
out the roll points for other markets from the data and posted their best guesses on forums, and
some report that the points have changed over the years without notice. You can set your own rule in
TradeStation quite easily, though. A suffix on the symbol chooses the contract, the trigger, and the
adjustment: @ES=209XR, for example, holds the second contract, rolls nine trading days before
expiry, and ratio-adjusts, and the trigger can instead be a number of days before first notice or
delivery, or a number of consecutive days on which the next contract’s open interest or volume is
higher.9 That fixes the opacity, but you still have to know which rule to choose.
CSI Data goes furthest in that direction. Its Unfair Advantage software lets you roll on calendar days, trading days before expiry, volume, open interest, or both, with confirmations if you want them, and build eight kinds of continuous contract, from back-adjusted and ratio series to two “Perpetual” blends and a “Gann Contract”. Its description of them is thin, though: it doesn’t say which settings are the default or which prices it uses to measure the gap, and it offers the blends, which are prices no contract ever traded at, under a heading that promises them “for back-testing your trading strategies”.
Rolling on the last trading day needs no volume data and no judgement, and on 20 April 2020 it went badly wrong. The May crude oil contract settled at −37.63 that day, a day before it expired, and the June contract settled at 20.43. The May contract traded 104,786 contracts on Globex that day, against 951,451 in June, so it had about 10% of the volume, yet a series that rolls at expiry shows the front-month price of crude oil at −37.63. The volume chart earlier shows the everyday version of the same problem: a series that rolls at expiry holds ES for a week with a median 16% of the volume, and gold, notes, and corn for weeks into their delivery periods.
We analysed FirstRate Data’s daily and one-minute continuous files for ES, which it describes as “absolute adjusted”, by rebuilding them from the dated contracts. The daily file turned out to roll seven calendar days before expiry and to take the settlement price as the close. The one-minute file, offered as the same series, used different roll dates, joined contracts at midnight New York time on dates that weren’t consistent from one roll to the next, and carried a different set of adjustments. And from about September 2025 the daily file stopped adjusting at all: the gaps of about +50 points in March 2026 and +62 in June 2026 were left in the series as price moves, while the history before them still carried the old constants (+294.50 in 2010). The vendor didn’t announce any of this, and we only found it because we had the contracts to compare it with. This sort of arbitrary behaviour is far more common than most traders realise.
Rule changes are the worst case for auditing, and they happen. TradingView added back-adjustment for CME futures in November 2022 and for other exchanges over the next two years, CME changed its own published equity roll date between 2022 and 2023, and Quandl’s free continuous series simply stopped updating. If a vendor changes how it rolls, then the whole adjusted history changes the next time you download it, and the same strategy on the same market gives different results with no change to your code, which you can’t explain unless you kept the old file. If you have to use a vendor’s series, keep every download and compare each new one with the last before you trust it.
A roll you can actually trade
A continuous series records what you held, but somebody still has to trade the roll, every month or quarter, for years. If that somebody is you, the rule has to be one you can carry out through your own broker, at an hour that suits you, without making a decision on the day. For us that settles the argument for a calendar rule, because a rule that depends on tomorrow’s volume can’t be planned for, and one that needs judgement on the day will eventually be skipped or done twice.
The broker sets hard limits: at Interactive Brokers, the standard close-out deadline for a long position in a physically delivered contract is the end of the second business day before first notice day, and for a short, the second business day before the last trade. After that, the broker “may, without additional prior notification, liquidate” the position.10 Our rules keep every roll at least one business day before the deadline, which means two days before first position day in gold and two days before the last trade in crude oil. For some markets the deadline sets the date by itself. Interactive Brokers closes out Norwegian krone, Swedish krona, and Korean won futures five business days before the last trade, which forces their rolls well before the volume moves, while the major currencies are exempt in margin accounts.
Then there’s the clock, because we trade from Melbourne. The settlement that measures the December 2026 ES roll (15:00 Chicago time on Friday 11 December) falls at 08:00 on a Saturday there, and the one for this month’s crude oil roll (13:30 Chicago time on 15 October) fell at 05:30 on a Friday. Neither is a time we’d choose to trade, and we don’t have to, because the settlement pair is only a convention for measuring the gap. The spread can be traded at a sensible hour on R−1, while it’s liquid, and the difference from the settlement pair recorded as signed slippage, which can go either way.
We measured that difference by reconciling the Panama series against a ledger of the dated contracts, holding one contract long from June 2010 to October 2026 and rolling it at every seam. Rolled at exactly the settlement pair, the ledger matched the series to the last point in all six markets (6,079.40 points in ES), which confirms that the adjustment applies each seam’s gap and nothing else. We then rolled it at the last trades an hour before the settlement window on R−1, which makes the ledger’s difference from the series the sum, over the rolls, of the settlement spread minus the spread actually traded. The traded spread differed from the settlement spread by a median of one tick in ES, gold, and corn, two in crude oil, three in natural gas, and none in the 10-year note, in either direction. Over 16 years the differences came to $343 per contract in the long’s favour in ES, against $303,970 for the series, and $4,710 in its favour in natural gas, against a loss of $116,700. Neither figure includes commissions or the bid-offer on the spread, which are paid on every roll and don’t net out.
Trade the roll as a calendar spread, which is one order at one price for both legs, so you’re never left holding one leg because the other didn’t fill. Carver reckons that trading the spread roughly halves the execution cost, where there’s a liquid spread market, and in roll week the calendar spreads in the index futures and crude oil are very liquid.11 The list of futures Interactive Brokers gives its customers, which we checked, offers trade-at-settlement only for VIX futures on Cboe and for no CME contract, so you can’t buy the settlement pair itself. A backtest that fills both legs at the settlement prices is therefore optimistic, and should charge at least half the calendar spread’s usual bid-offer on every roll. Exchange margin on a calendar spread is far lower than on two outright positions, but if you trade the legs as two separate orders, then you’ll briefly need margin for both.
Which series for what
Once you have the dated contracts and the roll schedule, each part of a strategy should use the series that suits it:
| What you’re calculating | Which series |
|---|---|
| Signals measured in points (breakouts, moving averages, point stops) | Panama |
| Returns, volatility, and comparisons across markets | ratio, or Panama point moves divided by the unadjusted price |
| Order prices: limits, stops, and targets | the held contract, so translate any adjusted level back by subtracting the Panama constant or dividing by the ratio factor |
| Fills, profit and loss, and margin | the held contract |
| Carry priced in at each roll | the gap at each roll, from the dated contracts |
The gaps are worth keeping for their own sake, because each one measures the carry priced into the new contract. Nothing is debited at the roll itself, and the carry is realised through marking to market as the new contract’s price converges on the cash price, but over the years it adds up. One ES contract held long from June 2010 and rolled every quarter made 657 points less than the chart of front-month prices suggests, which is roughly the cost of financing the index less its dividends. In natural gas the carry was the whole story: the front-month price fell by 35% over the same 16 years, but the funded, ratio-linked long described earlier lost 98.6%.
Data integrity
Most of the problems in a home-built series come from the inputs, and none of them stops a backtest from running. Each is a choice between two readings of the exchange’s data that both look reasonable, and the hard part is making the same choice everywhere, in the bars, the roll schedule, and the backtest. These are the ones we’ve had to deal with:
- Expiry and definitions. A contract with no definition, or with two definitions that give different expiries, has to be flagged instead of guessed. Expiries are sometimes restated, too, so check that the date you used was known before the roll (we checked 193 cases, and it was in all of them).
- Settlements. Expect re-sends at a different price (20,496 contract-days in our CME data, 838 of them at zero), holiday placeholders that repeat an earlier price, final settlements published after midnight UTC, and sessions that traded but never settled. Before this post we had three rules in one archive for which record is the settlement, and we still have two.
- Thin contracts. The incoming contract can have gaps in its minute data before the roll, and a contract can be listed for months before it trades at all. A single one-lot trade in a back month can show a move of several per cent that the rest of the curve didn’t make, so a check on the gap at a roll should compare it with the neighbouring contracts and allow for liquidity.
- Calendars. On Good Friday 2026 ES traded an overnight session of 71,443 contracts and had no regular session at all, so a regular-hours series correctly has no bar for that date. CME’s crypto futures now book weekend trading to Monday, so their Monday bar covers about 72 hours.
- Point in time. Knowing that a deferred contract exists isn’t look-ahead, because exchanges list contracts months or years in advance and a trader in 2014 could see them, but using a contract’s statistics or definition before they were published is.
- Mixed sources. A long history may have changed provider partway through. Never build one bar from two providers’ data, and know where the change happens.
- Reproducibility. When you change a rule, the old series should still be reproducible. We keep an append-only record of every roll and its gap, in which a roll is sealed five days after it happens, once the final settlements have posted, and a change of rule starts a new version alongside the old one. The adjusted prices themselves are never stored, and each read recomputes them from the dated contracts, so a correction to a contract’s bars shows up straight away and every read gives the corrected history. Reproducing an old backtest also needs the bars and settlements as they were when it ran, and the code that built the series, so a run should record the roll-rule version, a snapshot or revision of the data, and the code version.
Testing the roller
Running your roll code a second time checks nothing, because it repeats its own mistakes. Our check is a second implementation of the roll rules, written from the specification instead of from the code, and the build fails if it ever imports the code it’s checking. Once a month it recomputes every roll in the record and confirms:
- the roll date and the cut, from the rule and the exchange’s expiries alone;
- that no roll falls later than a day before the broker’s close-out date;
- that no bar straddles a cut;
- that every gap was measured from a settlement pair, or carries a flag saying why not;
- and that the held contract is where the volume is, from the crossover against the rule and the share of trade dates on which the held contract was the most active one.
The first full calibration, in October 2026, found 45 of 51 markets within a day and a half of their measured crossovers. Of the other six, two were currencies held early by the broker’s close-out, two were artefacts of measuring the crossover on a single day, and two (RBOB gasoline and Fed funds) led to new rules. The audit’s first runs were less tidy than that suggests. They turned up 132 empty stretches in five thin markets whose series began before anyone traded them, and 18 dairy rolls that fell on the day after Thanksgiving, when CME’s dairy markets are shut and our calendar thought they were open.
A checklist
If you build your own continuous series, or use someone else’s, these are the questions I’d want answered before trusting a backtest on it:
- Can you rebuild the series from the dated contracts and a written rule?
- Are the roll dates known in advance, and does every one fall before your broker’s close-out date?
- Is the gap measured from simultaneous prices, with every fallback flagged?
- Do orders and fills use the real contract’s prices, and does the backtest pay for the roll?
- Does a ledger of the dated contracts, rolled at the settlement prices, reproduce the series' profit and loss exactly?
- Can you reproduce last year’s series, with last year’s rule, data, and code?
- Has something that shares no code with the roller checked its roll dates?
References
- P. Brandt, “Continuation vs. Continuous Futures Charting” (20 May 2017), https://www.peterlbrandt.com/wp-content/uploads/2018/01/Continuation-vs.-Continuous-Futures-Charting-May-2017.pdf.
- R. Carver, “Systems building: futures rolling” (May 2015), https://qoppac.blogspot.com/2015/05/systems-building-futures-rolling.html, and a post on percentage and price differences (February 2023), https://qoppac.blogspot.com/2023/02/percentage-or-price-differences-when.html.
- R. Carver, pysystemtrade, an open-source Python framework for systematic futures trading, https://github.com/robcarver17/pysystemtrade, and its documentation on futures data, roll configuration, and multiple prices, https://github.com/robcarver17/pysystemtrade/blob/master/docs/data.md.
- CFTC, interim staff report on trading in NYMEX WTI crude oil futures on 20 April 2020 (23 November 2020), https://www.cftc.gov/PressRoom/PressReleases/8315-20.
- CME Clearing Advisory 20-171, the switch to a pricing model that allows negative prices from 22 April 2020, https://www.cmegroup.com/notices/clearing/2020/04/Chadv20-171.html.
- CME Group, equity index roll dates, archived 17 August 2022 (https://web.archive.org/web/20220817040258/https://www.cmegroup.com/trading/equity-index/rolldates.html) and 22 January 2026 (https://web.archive.org/web/20260122070119/https://www.cmegroup.com/trading/equity-index/rolldates.html); and “What is volume?”, https://www.cmegroup.com/education/courses/introduction-to-futures/what-is-volume.html.
- CSI Data, Unfair Advantage continuous-contract options, including the Perpetual Contract, https://csidata.com/?page_id=14.
- Databento, symbology for continuous contracts, https://databento.com/docs/standards-and-conventions/symbology.
- FirstRate Data, price adjustment, https://firstratedata.com/about/price_adjustment.
- Goldman Sachs, S&P GSCI roll period, https://www.goldmansachs.com/what-we-do/FICC-and-equities/business-groups/sts-folder/gsci/roll-period.html.
- Interactive Brokers, physical delivery and close-out rules for futures, https://www.interactivebrokers.com/en/trading/futures-close-out.php, and the TWS guide to continuous futures, https://ibkrguides.com/tws/usersguidebook/technicalanalytics/continuous.htm.
- Y. Mou, “Limits to Arbitrage and Commodity Index Investment: Front-Running the Goldman Roll” (November 2010), SSRN 1716841.
- Norgate Data, futures package, https://norgatedata.com/futurespackage.php.
- Pinnacle Data, CLC continuous contracts, https://pinnacledata2.com/clc.html.
- Quandl, continuous futures (archived July 2014), https://web.archive.org/web/20140714051325/http://www.quandl.com:80/futures/continuous.
- TradeStation, help on continuous futures contracts, https://help.tradestation.com/10_00/eng/tradestationhelp/tb/futures_continuous_contracts.htm, and on custom continuous futures symbols, https://help.tradestation.com/10_00/eng/TradeStationHelp/symbology/custom_continous_futures_symbology.htm.
- TradingView, “What are 1! and 2! continuous futures contracts?”, https://www.tradingview.com/support/solutions/43000483493-what-are-1-and-2-continuous-futures-contracts/; the dates continuous futures switch contracts, https://www.tradingview.com/support/solutions/43000691027/; and “Improvements for CME Group futures” (16 November 2022), https://www.tradingview.com/blog/en/improvements-for-cme-group-futures-34739/.
Method note: CME futures from Databento’s GLBX.MDP3 feed in our marketfeed archive: one-second bars for every dated contract of ES, CL, NG, GC, ZN, and ZC from 6 June 2010 to 15 October 2026, which the archive aggregates into one-minute and trade-date session bars, with the exchange’s settlement prices, cleared volume, open interest, and instrument definitions. Continuous series are built from the dated contracts’ one-minute bars, which give the same daily bars as the one-second data, on each market’s calendar rule, switching at the first instant of the roll date and joined at both contracts’ settlement prices on the day before; closes are last trades. Volatility is the standard deviation of daily percentage returns in the calendar year, annualised with 252 days, leaving out roll days, so it shows the adjustment’s effect on ordinary days and isn’t the volatility of everything a rolled position earned. The ledger holds one contract long from the series’ first close to its last; for the traded rolls, each leg is the last trade at or before one hour before the settlement window on R−1, and both must have traded in the previous 15 minutes, which left out one ES roll and three in the 10-year note. Volume shares use Globex-matched volume in each contract’s trade-date session.
The archive holds every dated CME contract from 6 June 2010, with one-second bars (and the minute and session bars built from them), settlement prices, and the exchange’s definition of each contract. The post starts in 2010 because that’s where Databento’s CME history starts. ↩︎
Robert Carver stitches with Panama by default in his open-source system, pysystemtrade, and keeps the price of the contract held beside it. Because the adjusted price can reach zero or go negative, he “strongly advocate[s] using the ‘current’ price as the denominator” when working out percentage returns (Carver, February 2023, in the references). ↩︎
Brandt (May 2017) describes the disagreement with Schwager. ↩︎
Databento’s documentation says its
vseries “will rank the expirations by the previous day’s trading volume”, and itsnseries by “the open interest at the previous day’s close”. Its continuous prices are “the original, unadjusted prices”. ↩︎CME’s equity index roll-date page, archived in August 2022 and January 2026, and its “What is volume?” course page. ↩︎
Goldman Sachs describes the S&P GSCI roll period. Mou’s paper (2010) measures the price impact of the roll and the returns from trading ahead of it, up to March 2010. ↩︎
The pysystemtrade documentation lists, for each market, the roll cycle it holds, the cycle it prices, and how many calendar days before expiry it rolls; crude oil and corn hold December only. ↩︎
FirstRate Data’s page on price adjustment. Our own reconstruction of its daily file, described below, found that the close was the settlement price. ↩︎
TradeStation’s help on continuous futures contracts and on custom continuous futures symbols, in the references. Both pages are from version 10 of its help. ↩︎
Interactive Brokers’ close-out rules for physically delivered futures, in the references. ↩︎
Carver, May 2015. ↩︎