More history may not be more evidence
Many systems developers proudly tell you over how long their system has been tested. Maybe it’s back to the 1970s, or back to the Great Depression, or even further back than that. The assumption that more data is better seems so self-evident that it’s hard to imagine it not being true. But what if it weren’t?
The belief that more data is better is useful for the trader staring at the results of a system that used to work but is undergoing a rough patch at the moment. Armed with lots of historical data, it’s easy for this trader to convince themselves that this is just a blip in a long period of success, and recovery is just around the corner. But what if the conditions that made the strategy profitable have been removed? Perhaps then the hundred years of data hold the evidence of a system that once traded well, but whose time has passed.
In Peering into daily bars we set 16 classic short-term trading rules, most of them built on statistics from the pit-traded markets of the early 1990s, against 16 years of ES one-minute data, and few of the trading rules showed an edge. This post asks the general version of that question. We measured a century of daily US equity returns decade by decade, tested published effects before and after publication, asked at every year-end since 1950 whether a long or a short look-back predicted the next 10 years better. Then we looked inside the E-mini day from 2010 to October 2026, down to the single seconds around the close, where the exchanges have moved the busiest second of the day twice since 2018.
For some things, the equity premium among them, the longest history was the best guide we found. For others it was a worse guide than the last 10 years alone, and for follow-yesterday it pointed the wrong way for 20 years. What separated the two was whether the edge came from something persistent about investors or from the plumbing of the market it was measured in.
The case for the longest history
Sharpe ratios are measured with a lot of error. Andrew Lo’s formula for the standard error of a Sharpe ratio estimated from T years of independent returns is roughly √((1 + ½SR²)/T).1 For a strategy with a true annual Sharpe ratio of 0.5, that comes to about 0.34 after 10 years and 0.11 after 100, and it takes about 18 years before the estimate sits two standard errors from zero. If you wanted to show that a Sharpe ratio of 0.5 had halved, which is about the size of decay the literature reports after publication, then you’d need well over a century of data on each side of the change. Fama and French made the same point about value in 2021. Its premium fell from 0.42% a month in 1963–91 to 0.11% in 1991–2019, and yet the difference between the two halves was only about 1.4 standard errors; as they put it, “the culprit is volatility”.2
There’s also good evidence that some edges last. Hurst, Ooi, and Pedersen tested trend following across 67 markets from 1880 and found a positive Sharpe ratio in every decade, with 0.77 for the whole sample after a notional 2-and-20 fee.3 Dimson, Marsh, and Staunton, with 126 years of returns from 35 markets, found negative premiums over whole decades in 22% of country-decades, so a single decade can mislead in either direction.4 Ilmanen and his colleagues looked at value, momentum, carry, and defensive strategies across six asset classes over about a century, and found no sign that publication had made them worse.5
Our own test agrees for the equity premium. At each year end from 1950 to 2015 we estimated the market’s excess return over bills from all the data since July 1926, and separately from the last 30, 20, 10, and five years, then compared each estimate with what the market actually earned over the following 10 years. The full history had the smallest error (5.3% a year, against 7.2% for the last 10 years and 8.0% for the last five) and got the sign right 91% of the time, because a short window gives a noisy estimate of a slow, noisy quantity.
The catch is that the square-root rule assumes every year is a draw from the same distribution, and if the distribution changed in 1975 or 1997 or 2015, then adding the years before the change doesn’t shrink your error; it moves your estimate towards the wrong answer, with growing confidence. Pesaran and Timmermann, who worked out how to choose an estimation window when there are breaks, concluded that it usually pays to include some data from before a break, because it reduces variance by more than it adds bias, but not all of it. The right amount has to be found by testing out of sample, which is roughly where we end up too.6
What has changed
These are the dated changes most likely to touch a US equity or index-futures strategy, each of which altered who trades, what trading costs, when it happens, or how a price gets recorded.
| date | change |
|---|---|
| 1933–34 | Securities Act and Securities Exchange Act; the SEC begins work on 1 July 1934. The dollar’s gold price is reset from 35 in January 1934 |
| 1952 | Last NYSE Saturday sessions; the French data has 1,158 of them, the last on 24 May 1952 |
| 4 March 1957 | S&P 500 launched; before that, S&P’s daily index was the 90-stock Composite |
| July 1962, December 1972 | AMEX and then Nasdaq stocks enter CRSP’s daily files; before July 1962 the “market” is the NYSE |
| 1 May 1975 | Fixed brokerage commissions end (“May Day”) |
| 21 April 1982 | S&P 500 futures start trading in the CME pit; options on them follow in January 1983 |
| 1988 | First market-wide circuit breakers, after the 1987 crash; first used on 27 October 1997 |
| 25 June 1992 | CME Globex launches |
| 22 January 1993 | SPY, the first US-listed ETF |
| 1997 | SEC order handling rules (from 20 January); tick size cut from 1/8 to 1/16 (NYSE from 24 June); E-mini S&P 500 launched on Globex on 9 September |
| 2000–01 | Decimal prices, phased in by April 2001 |
| 2007 | Reg NMS compliance (March to October); the uptick rule repealed (July) |
| 6 May 2010 | Flash crash; LULD price bands follow, phased in from April 2013 |
| 18 November 2012 | ES full session extended from 15:15 to 16:15 CT, with a 15:15–15:30 halt inside the trade date |
| 19 June 2015 | CME closes its equity-index futures pits, except the full-size S&P 500 |
| 29 October 2018 | Nasdaq moves its market-on-close cut-off, and its first imbalance message, from 15:50 to 15:55 |
| 1 April 2019 | NYSE moves its on-close cut-off and imbalance publication from 15:45 to 15:50 |
| 6 May 2019 | Micro E-mini futures, a tenth of ES |
| October 2019 | Schwab, TD Ameritrade, and E*Trade cut online stock and options commissions to zero |
| 4 November 2019 | Nasdaq adds an early imbalance message at 15:50, repeated every 10 seconds, and stops on-close orders being cancelled after 15:50 |
| 13 March 2020 | CME’s Chicago trading floor closes for Covid and never reopens; the full-size S&P 500 contract is delisted after September 2021 |
| 28 June 2021 | The 15:15–15:30 CT halt in equity-index futures is removed |
| April–May 2022 | Cboe adds Tuesday and Thursday SPX expiries; SPX options now expire every trading day |
| 2 May 2023 | The CFTC restates its consolidated S&P 500, Nasdaq-100, and Dow positioning figures in E-mini units |
| 28 May 2024 | US stock settlement moves to T+1 |
| 14 May 2025 | The SEC’s Section 31 fee on sales of US stocks is set to zero |
| 2 April 2026 | The Section 31 fee returns, at $20.60 per million dollars of sales |
| 29 May 2026 | CME crypto futures trade around the clock |
| 24 August 2026 | E-nano equity futures, a hundredth of an E-mini |
The sources for every row are in the footnote.7 Four kinds of change need more than a row: who trades, where the trading happens, how the data was put together, and the positioning reports that are meant to tell you who’s on the other side. The first three are the ones traders usually reach for when they say the market has changed, and the fourth is easier to miss.
The participants. Zero-day SPX options were about 5% of SPX volume in 2016. By August 2023 they were about half, in 2025 they were 59%, and in July 2026 they set a record at 66%.8 Cboe’s own estimate is that retail accounts for around 53% of zero-day volume. In futures, CME says micro equity contracts made up 40.5% of its equity-index volume by contract count in December 2025, and in August 2026 it launched a contract a tenth the size of the micro.9 Retail’s share of US stock volume has no official measure, but industry estimates put it at around a fifth in 2025, against about 15% in 2019.10 And by the end of 2025, index funds held 52% of US long-term fund assets, up from 19% in 2010.11
The venue. S&P 500 futures began in a pit in 1982, and the electronic E-mini arrived in 1997; by 2000, Hasbrouck found, most of the price discovery in S&P futures was happening in the E-mini.12 The equity pits closed in 2015 and the floor itself in 2020.
The data itself. Old data also differs in how it was put together. CRSP’s daily files cover only the NYSE before July 1962. The S&P 500 has existed since 1957, and S&P Dow Jones Indices says plainly that figures from before an index’s launch date are back-tested. Shiller’s long monthly series uses monthly averages of daily prices, and Holbrook Working showed in 1960 that averaging a random walk creates a first-order autocorrelation of about 0.25 that isn’t in the underlying prices.13 The CFTC’s Traders in Financial Futures history before 2010 was backfilled using later classifications of traders, which the CFTC says makes it less accurate the further back it goes. Even the long US record is a survivor: Jorion and Goetzmann found that real US price gains of 4.3% a year from 1921 to 1996 compared with a median of 0.8% across 39 markets, so the long US record comes from the century’s most successful market.14
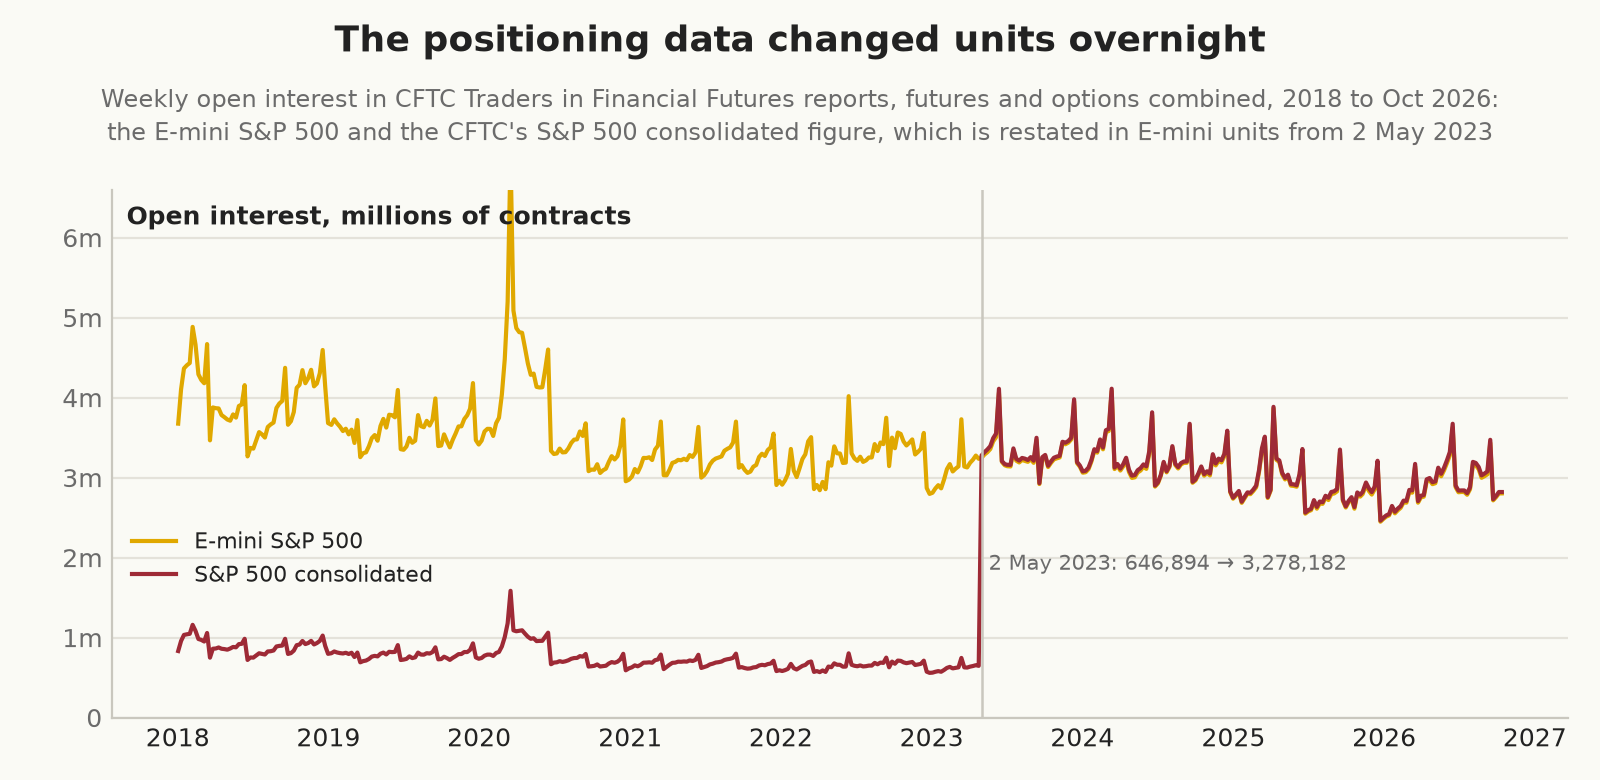
The positioning data. Positioning reports have breaks of their own, and they’re easy to miss because the CFTC publishes each market as one continuous series. On the report for 2 May 2023, the CFTC’s consolidated S&P 500 open interest went from 646,894 contracts to 3,278,182, in a week when the E-mini’s own open interest barely moved (3,234,472 to 3,248,741). The consolidation had switched from full-size units, in which an E-mini counted as a fifth, to E-mini units, in which a micro counts as a tenth, and the Nasdaq-100 figure jumped fivefold on the same report. Between 2010 and 2026, 25 contracts also moved from one CFTC commodity code to another. In February 2023 a ransomware attack on ION, a supplier of clearing software, held up the reports for several weeks.15 The categories are softer than they look, too, since a trader’s category comes from how it describes its own business, and that description can outlast the business that earned it, so a “commercial” isn’t necessarily a hedger.
A century, decade by decade
We started with the longest clean daily series that’s freely available, Ken French’s daily US market and factor returns, which are built from CRSP and run from 1 July 1926 to 31 August 2026. The market is CRSP’s value-weighted index, which until July 1962 covers only the NYSE.16
| decade | excess return %/yr | volatility %/yr | days beyond ±2% | lag-1 autocorrelation | Sharpe |
|---|---|---|---|---|---|
| 1926–29 | 14.0 | 20.6 | 5% | 0.13 | 0.68 |
| 1930s | 3.7 | 30.2 | 18% | 0.05 | 0.12 |
| 1940s | 9.6 | 13.6 | 2% | 0.16 | 0.71 |
| 1950s | 15.5 | 10.2 | 1% | 0.13 | 1.52 |
| 1960s | 4.7 | 9.8 | 1% | 0.20 | 0.47 |
| 1970s | 0.7 | 13.3 | 3% | 0.29 | 0.05 |
| 1980s | 8.3 | 15.3 | 3% | 0.13 | 0.54 |
| 1990s | 12.6 | 13.4 | 3% | 0.08 | 0.95 |
| 2000s | −0.6 | 22.3 | 11% | −0.06 | −0.03 |
| 2010s | 13.4 | 15.2 | 5% | −0.04 | 0.88 |
| 2020–26 | 13.7 | 20.8 | 8% | −0.15 | 0.66 |
Returns, volatility, and Sharpe ratios are annualised with each period’s actual number of sessions a year. That matters before 1952, when the NYSE also traded on Saturdays and there were about 300 sessions a year, against about 252 today. The first and last rows are partial, covering three and a half years and six and two-thirds, so they’re noisier than the rest; a Sharpe ratio estimated from three and a half years has a standard error of about 0.6, against about 0.3 for a full decade.
The first thing that stands out is how different the decades are. Volatility ranged from under 10% a year in the 1960s to 30% in the 1930s, and the share of days moving more than 2% ranged from one in a hundred to nearly one in five. Any rule with a fixed stop, a fixed target, or a fixed position size sees a different market in each row.
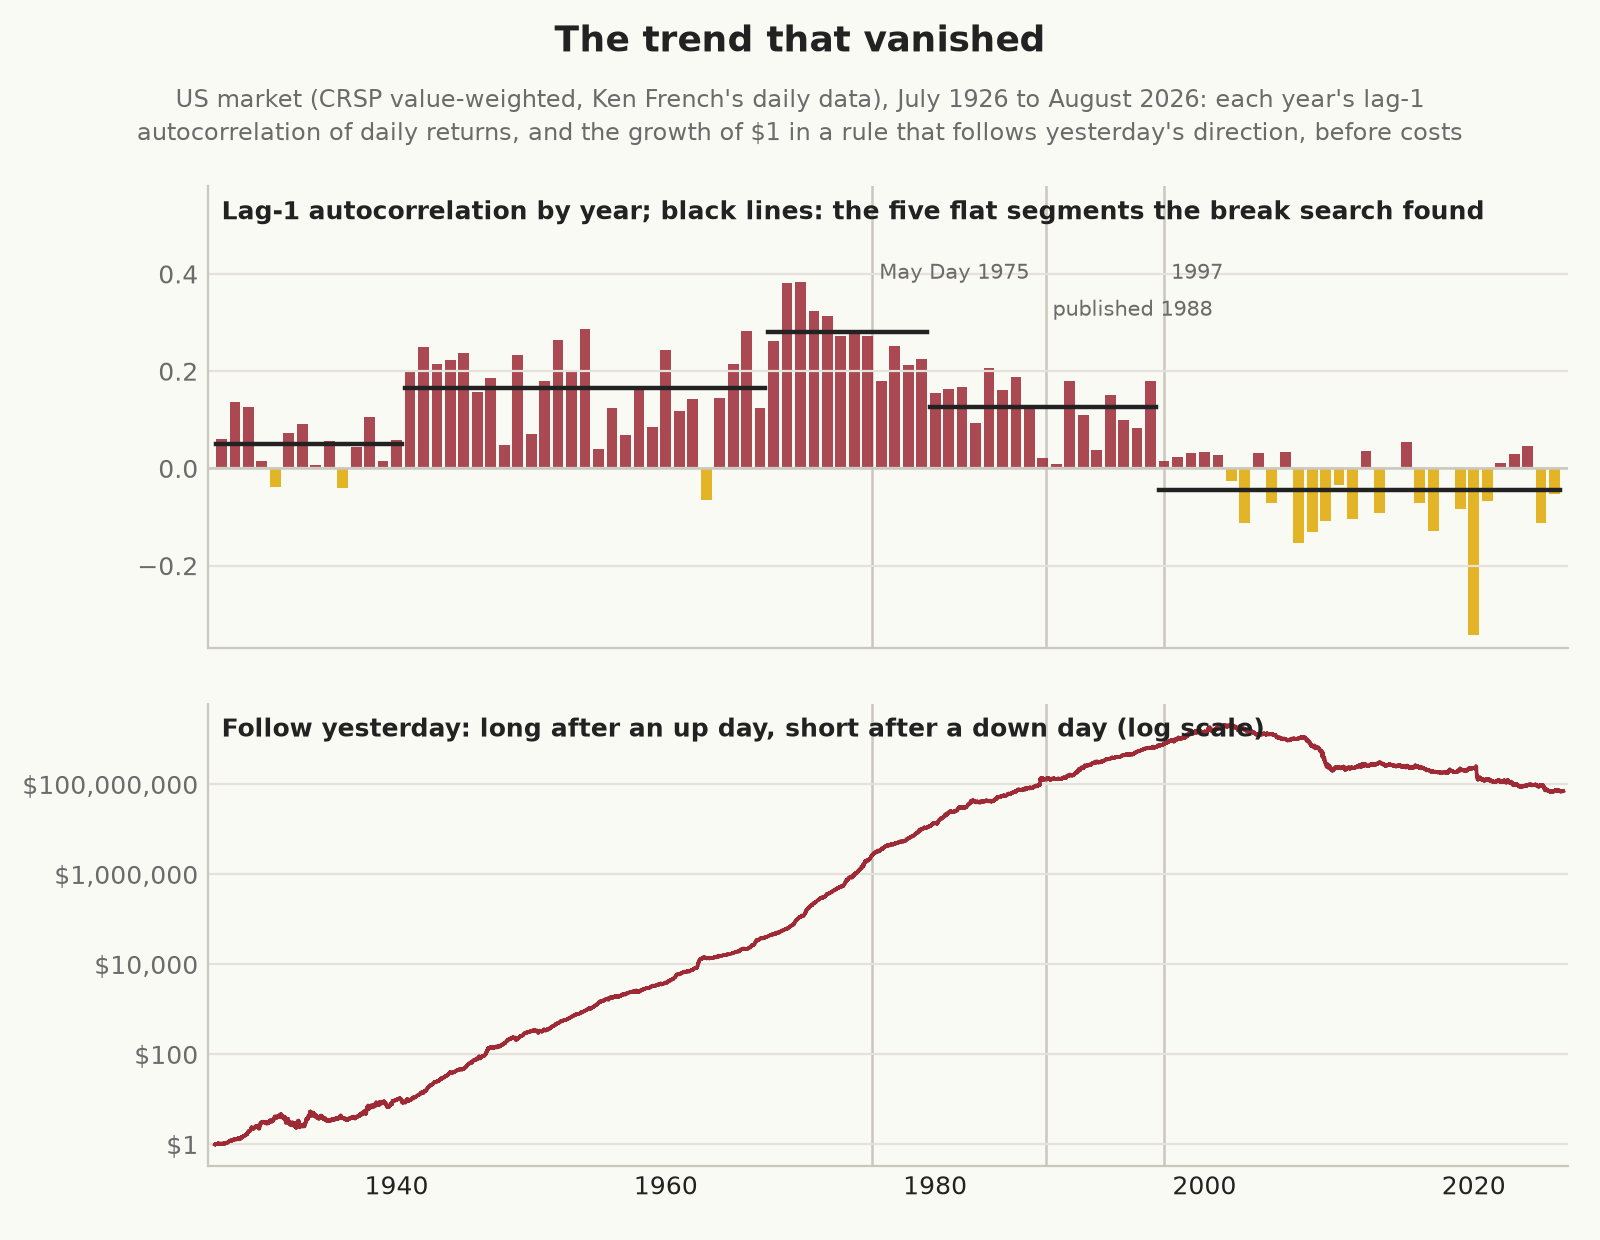
The second is the column that gets the least attention. Until the late 1990s, a day’s return told you something about the next day’s: the lag-1 autocorrelation averaged about 0.15, and in the 1970s it was 0.29. Since 2000 it has hovered around zero or below.
Other researchers have found the same thing in other data. Campbell, Grossman, and Wang reported a daily autocorrelation of about 0.2 for the value-weighted index, and nearly 0.3 in 1962–74.17 Baltussen, van Bekkum, and Da found that across 20 indexes in 15 countries, index autocorrelation that had been positive until the 1990s turned negative from the 2000s, and they linked the change to the growth of index futures, ETFs, and index funds.18
The trend that vanished
The simplest rule that feeds on positive autocorrelation is to follow yesterday: be long the market after an up day and short after a down day. On the whole market, before costs, it looked like this.
| decade | Sharpe, whole market | Sharpe, largest 10% of stocks | gross bp/day | one-way cost that wipes it out, bp |
|---|---|---|---|---|
| 1926–29 | 1.70 | 1.29 | 11.8 | 13.8 |
| 1930s | 0.53 | −0.14 | 5.3 | 5.4 |
| 1940s | 2.71 | 2.48 | 12.4 | 14.6 |
| 1950s | 2.51 | 2.71 | 9.7 | 11.7 |
| 1960s | 3.57 | 3.11 | 13.7 | 17.1 |
| 1970s | 3.82 | 2.78 | 19.4 | 24.1 |
| 1980s | 1.69 | 0.77 | 10.2 | 11.1 |
| 1990s | 1.73 | 0.88 | 9.1 | 10.1 |
| 2000s | −0.70 | −1.22 | −6.2 | – |
| 2010s | 0.05 | −0.27 | 0.3 | – |
| 2020–26 | −0.76 | −0.79 | −6.3 | – |
Over the whole period the rule has a Sharpe ratio of 1.13. Anyone who ran it on a hundred years of data would find 60 years of spectacular results, a bad patch, and a long-run average that looks excellent, and they’d have been wrong about it in every year of the last quarter century. Since Lo and MacKinlay published the autocorrelation in 1988, the rule’s Sharpe ratio has been 0.00, and over the last 10 years it has been −0.48.19
Some of the old result was an illusion, since an index of stocks that don’t all trade every day moves late: the quiet stocks catch up tomorrow with what the busy ones did today, and so the index appears to trend. The smallest tenth of stocks had a lag-1 autocorrelation of 0.49 in the 1970s. But stale prices can’t explain all of it, since the largest tenth of stocks, which traded all day, still had an autocorrelation of 0.22 in the 1970s and gave the rule a Sharpe ratio of 2.78.
It also couldn’t have been traded at anything like those numbers. The rule changed position on about 40% of days, and a reversal trades twice the position, so in the 1970s it broke even at about 24 basis points per trade. Brokerage commissions were fixed until 1 May 1975, and there was no cheap way to trade the whole market at once until index futures arrived in 1982. Through the 1980s and 1990s the breakeven was about 10 basis points, and since 2000 there has been nothing to break even on.
We also asked where the change happened, instead of assuming that decades are the right unit. We computed the lag-1 autocorrelation for each calendar year and searched for the set of break dates that best splits that series into flat segments, choosing the number of breaks by the Bayesian information criterion, which settled on four.20
| segment | years | mean lag-1 autocorrelation |
|---|---|---|
| 1927–1940 | 14 | 0.05 |
| 1941–1967 | 27 | 0.16 |
| 1968–1979 | 12 | 0.28 |
| 1980–1996 | 17 | 0.13 |
| 1997–2026 | 30 | −0.04 |
The last break falls in 1997, the year the SEC’s order handling rules began letting public limit orders compete with Nasdaq dealers’ quotes (from 20 January) and the NYSE cut its tick from an eighth of a dollar to a sixteenth (24 June). They were the first steps on the way to decimal prices in 2001.21 A break found in annual data is only located to within a few years, and we aren’t claiming that tick sizes alone killed the effect, since electronic trading, index funds, and index futures were all growing through the same years. But a run of bad luck doesn’t usually produce a change of sign that lasts 30 years.
Published effects, before and after
The day-to-day trend is one of several effects that changed once people knew about them. McLean and Pontiff studied 97 published return predictors and found that their returns were 26% lower after the end of the original study’s sample and 58% lower after publication.22 Chordia, Subrahmanyam, and Tong found that a combined anomaly strategy’s average return and Sharpe ratio roughly halved after the move to decimal prices.23 The French data lets us look at four famous effects alongside the day-to-day trend.
| effect | published | before: %/yr | before: Sharpe | after: %/yr | after: Sharpe | last 10 years: %/yr | last 10 years: Sharpe |
|---|---|---|---|---|---|---|---|
| Follow yesterday | Lo & MacKinlay, 1988 | 32.0 | 1.86 | −0.1 | 0.00 | −9.0 | −0.48 |
| Size (small minus big) | Banz, 1981 | 2.0 | 0.21 | −0.2 | −0.02 | −1.9 | −0.18 |
| Value (high minus low) | Fama & French, 1992 | 4.8 | 0.51 | 2.3 | 0.20 | −0.4 | −0.03 |
| Momentum (winners minus losers) | Jegadeesh & Titman, 1993 | 7.3 | 0.65 | 5.2 | 0.34 | 4.0 | 0.22 |
The Monday effect, which Kenneth French documented in 1980, went the same way.24 In every decade from the 1920s to the 1980s, Monday’s excess return was 16 to 37 basis points below the average of the other days; since 1990 the gap has been between −7 and +7 basis points, and in the 2020s Monday has been the better day. William Schwert’s version of this is the neatest illustration of the whole problem I know of. Pooled over 1885 to 2002, the weekend effect has a t-statistic of −10, the kind of number that ends arguments, but over 1978–2002 alone it was −1.4, so nearly all of the evidence came from markets that had already gone.25
Momentum is the exception, and an important one: its returns fell after publication but didn’t vanish, and it still earned 4% a year over the last decade, which is what you’d expect from an edge rooted in how investors behave, since investors haven’t changed much since 1993. Outside the US the picture is similar: Ilmanen and his colleagues found no post-publication decay in momentum across asset classes, and Jacobs and Müller, looking at 241 anomalies in 39 countries, found that the United States was the only market with a reliable decline after publication.26
How far back should you look?
At each year end from 1950, we estimated the average return of each rule in five ways: from all the data since July 1926, and from the last 30, 20, 10, and five years. We then compared each estimate with what the rule actually earned over the next 10 years. If more history is always better, then the first column should always win.
| rule | all since 1926 | last 30 years | last 20 years | last 10 years | last 5 years |
|---|---|---|---|---|---|
| Equity premium | 5.3 | 6.1 | 6.8 | 7.2 | 8.0 |
| Size | 3.3 | 3.6 | 4.2 | 5.2 | 7.6 |
| Value | 3.5 | 3.5 | 3.8 | 4.5 | 5.0 |
| Momentum | 4.9 | 5.4 | 5.7 | 5.3 | 6.0 |
| 200-day trend rule, value added | 3.4 | 3.2 | 3.1 | 3.1 | 3.9 |
| Follow yesterday | 23.2 | 21.2 | 18.5 | 17.4 | 16.9 |
| Monday (bp per Monday) | 11.5 | 8.5 | 7.9 | 7.8 | 9.1 |
The table shows the root-mean-square error of each forecast against the next 10 years, in per cent a year except for the Monday row. Lower is better, and the best in each row is in bold.
The long history won for the equity premium, size, value, and momentum. For the day-to-day trend and the Monday gap it lost, and for follow-yesterday it lost badly: the full-history estimate got the direction of the next decade right 73% of the time, against 83% for the last 10 years, and its average error was a third larger.
The forecast periods overlap, since each year end shares nine of its 10 forward years with the next, so the table is a description and can’t serve as a formal test. The gaps between the columns are large enough that I don’t think the overlap changes the reading.
Will it have its time again?
Perhaps the greatest dilemma for a systematic trader is what to do with a strategy that used to work well, but now doesn’t. Consider a strategy that works according to the long history, but has not worked in the last decade. Should a trader, based on this long history, reasonably conclude that it’s due to come good? We picked out every year-end at which a rule’s average since 1926 was positive, but its trailing 10-year average was negative, and we looked at what happened next.
| rule | such year ends | next 5 years positive | next 5 years %/yr | next 10 years positive | for comparison: any year end, next 10 years positive |
|---|---|---|---|---|---|
| Equity premium | 6 | 6 of 6 | 11.3 | 6 of 6 | 74 of 80 |
| Momentum | 12 | 11 of 12 | 3.3 | 10 of 10 | 75 of 80 |
| Size | 33 | 20 of 29 | 2.3 | 22 of 27 | 47 of 80 |
| Value | 10 | 1 of 5 | −2.3 | 0 of 1 | 70 of 80 |
| Follow yesterday | 18 | 3 of 13 | −6.3 | 1 of 9 | 62 of 80 |
The equity premium came back every time it was written off, and so did momentum. The day-to-day trend didn’t: in 13 cases where the century said “it’ll come back” and five years have since passed, it came back three times, and over the following decade it was positive once in nine. Value’s dormancy is too recent to judge, because all of its cases date from 2015 onwards and only one has had 10 years to play out.
Inside the modern day
A century of daily closes can’t show what has happened within the day, and that’s where most of the recent change has been. For that we went back to the ES one-minute data from Peering into daily bars, covering 7 June 2010 to 16 October 2026, and always compared a contract with its own previous day so that rolls don’t enter.
Who trades
CME launched the Micro E-mini, a tenth of the size of ES, on 6 May 2019. In 2026 so far it has been 47% of all S&P futures contracts traded, though only 8% of the notional value, which makes it a market within the market for traders to whom one ES contract is too big.
| year | ES contracts a day (median) | MES contracts a day (median) | MES share of contracts | MES share of notional |
|---|---|---|---|---|
| 2018 | 1,380,876 | – | – | – |
| 2019 | 1,309,322 | 175,996 | 11% | 1.2% |
| 2020 | 1,613,168 | 870,134 | 33% | 4.7% |
| 2022 | 1,753,410 | 1,316,647 | 43% | 6.9% |
| 2024 | 1,342,592 | 870,502 | 39% | 5.9% |
| 2026 | 1,391,560 | 1,158,484 | 47% | 8.1% |
What a tick is worth
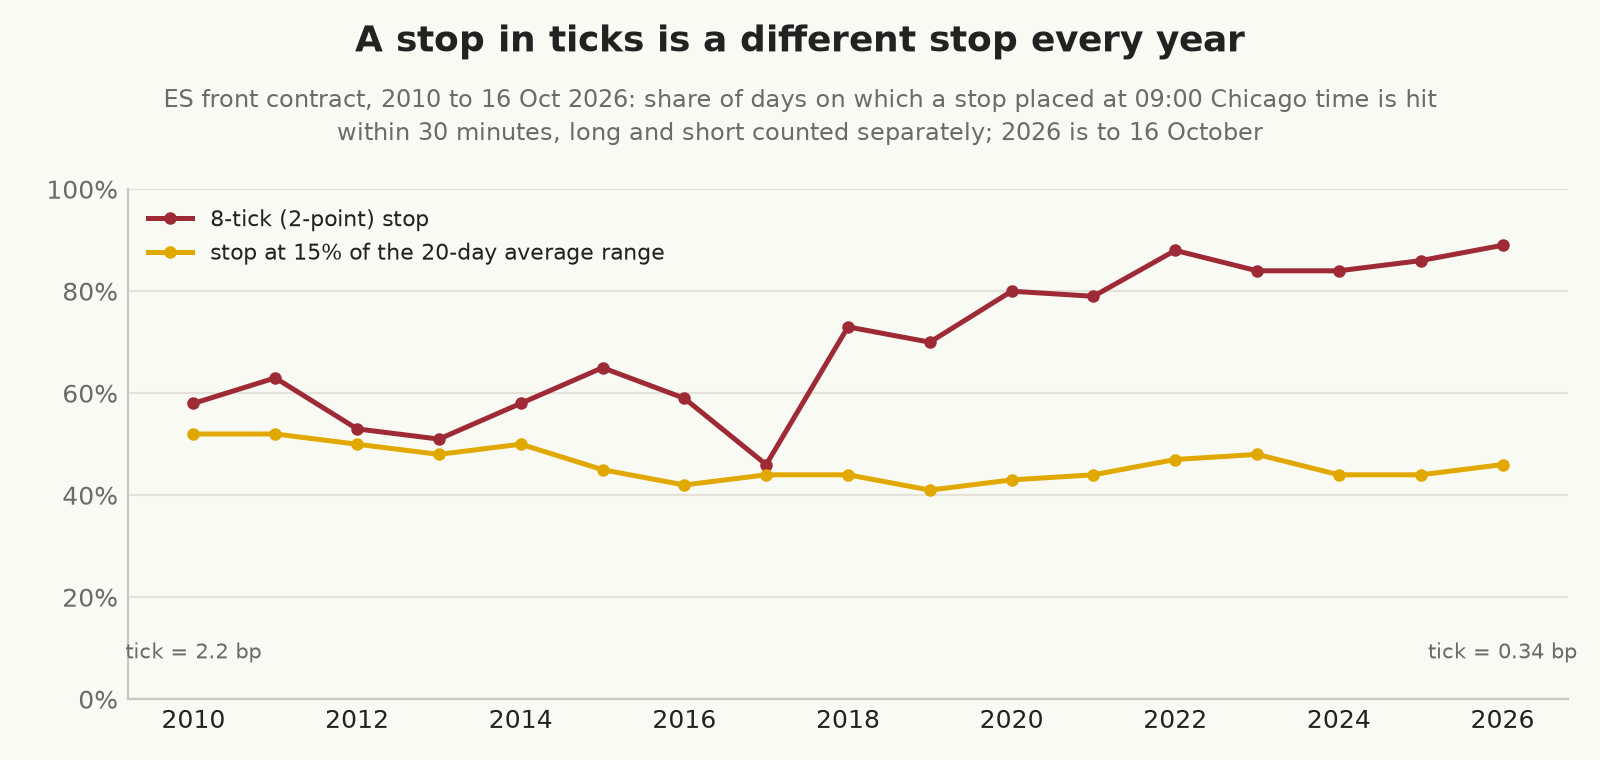
ES has traded in quarter-point ticks since it was launched, while the index it tracks has risen more than sixfold since 2010. A tick that was 2.2 basis points of the price in 2010 is 0.34 basis points in 2026, and the median cash-session range has grown from about 50 ticks to about 260, so any rule written in ticks has quietly turned into a different rule. To see how different, we placed a notional 8-tick (2-point) stop at 09:00 each day and counted how often the next 30 minutes traded through it, for a long and a short separately, and did the same for a stop set at 15% of the 20-day average range.
| year | price | tick in bp | median cash-session range in ticks | 8-tick stop hit within 30 minutes | 15%-of-range stop hit within 30 minutes |
|---|---|---|---|---|---|
| 2010 | 1,143 | 2.19 | 49 | 58% | 52% |
| 2014 | 1,927 | 1.30 | 59 | 58% | 50% |
| 2018 | 2,744 | 0.91 | 100 | 73% | 44% |
| 2022 | 4,045 | 0.62 | 278 | 88% | 47% |
| 2026 | 7,428 | 0.34 | 258 | 89% | 46% |
In 2010 the 8-tick stop survived its first half hour a little under half the time; in 2026 it was taken out nine times in ten. The stop that scaled with the market, about 8 ticks wide in 2010 and about 41 in 2026, was hit on 41–52% of occasions in every year from 2010 to 2026.
Costs moved the same way, since one tick of slippage on the way in and one on the way out cost about 4.4 basis points in 2010 and 0.7 in 2026. A backtest that charges a tick a side, which is a common default, therefore charges a 2010 trade six times as much as a 2026 one, in proportion to the price. The 30-minute opening-range breakout (buy a tick above the first half hour’s high or sell a tick below its low, stop at the other side, out at the cash close) shows how this plays out. Over 2010–14 it lost 1.4 basis points a trade before costs and 4.8 after them, for a Sharpe ratio of −1.37; over 2022–26 it made 2.4 before costs and 1.4 after, for a Sharpe ratio of 0.38. A backtest that starts in 2010 says the breakout loses money, and one that starts in 2022 says it works.
The close got crowded
The intraday volume curve has changed as well, most of all around the cash close.
| year | 08:30–09:00 | 11:00–13:00 | 14:50–15:00 | 15:00–15:15 |
|---|---|---|---|---|
| 2010 | 13.7% | 16.1% | 5.7% | 6.1% |
| 2014 | 14.8% | 17.9% | 5.7% | 5.8% |
| 2017 | 13.8% | 17.7% | 9.6% | 7.2% |
| 2020 | 12.6% | 19.2% | 8.8% | 4.7% |
| 2023 | 13.1% | 19.9% | 8.4% | 3.7% |
| 2026 | 13.3% | 20.8% | 9.3% | 3.2% |
The table shows each window’s share of the year’s 08:30–15:15 ES volume. Up to 2016 the ten minutes before the 15:00 cash close carried about 6% of it; since 2017 they have carried between 7.9% and 9.6%. Over the same years the quarter hour after the cash close lost half its share, and the middle of the day gained nearly five points. Bogousslavsky and Muravyev found that closing auctions went from 3.1% of US stock volume in 2010 to 7.5% in 2018, largely because index funds and ETFs trade there, and it’s a fair guess that the futures trading around the cash close has followed them.27
The second that moved
The cash close has a timetable inside it, and that timetable has changed three times since 2018. Nasdaq’s closing auction accepts market-on-close orders until a cut-off and publishes the imbalance between buyers and sellers from a set time, and the index futures and the ETFs on the same indexes jump in the seconds when that information arrives. In the futures post we found that 15:50:00 and 15:55:00 New York time are the most violent seconds of the regular session in all four CME index futures. In the ETF post we found that QQQ and SPY jump in the same two seconds, SPY included, although it’s listed on NYSE Arca, whose auction runs to a different clock.
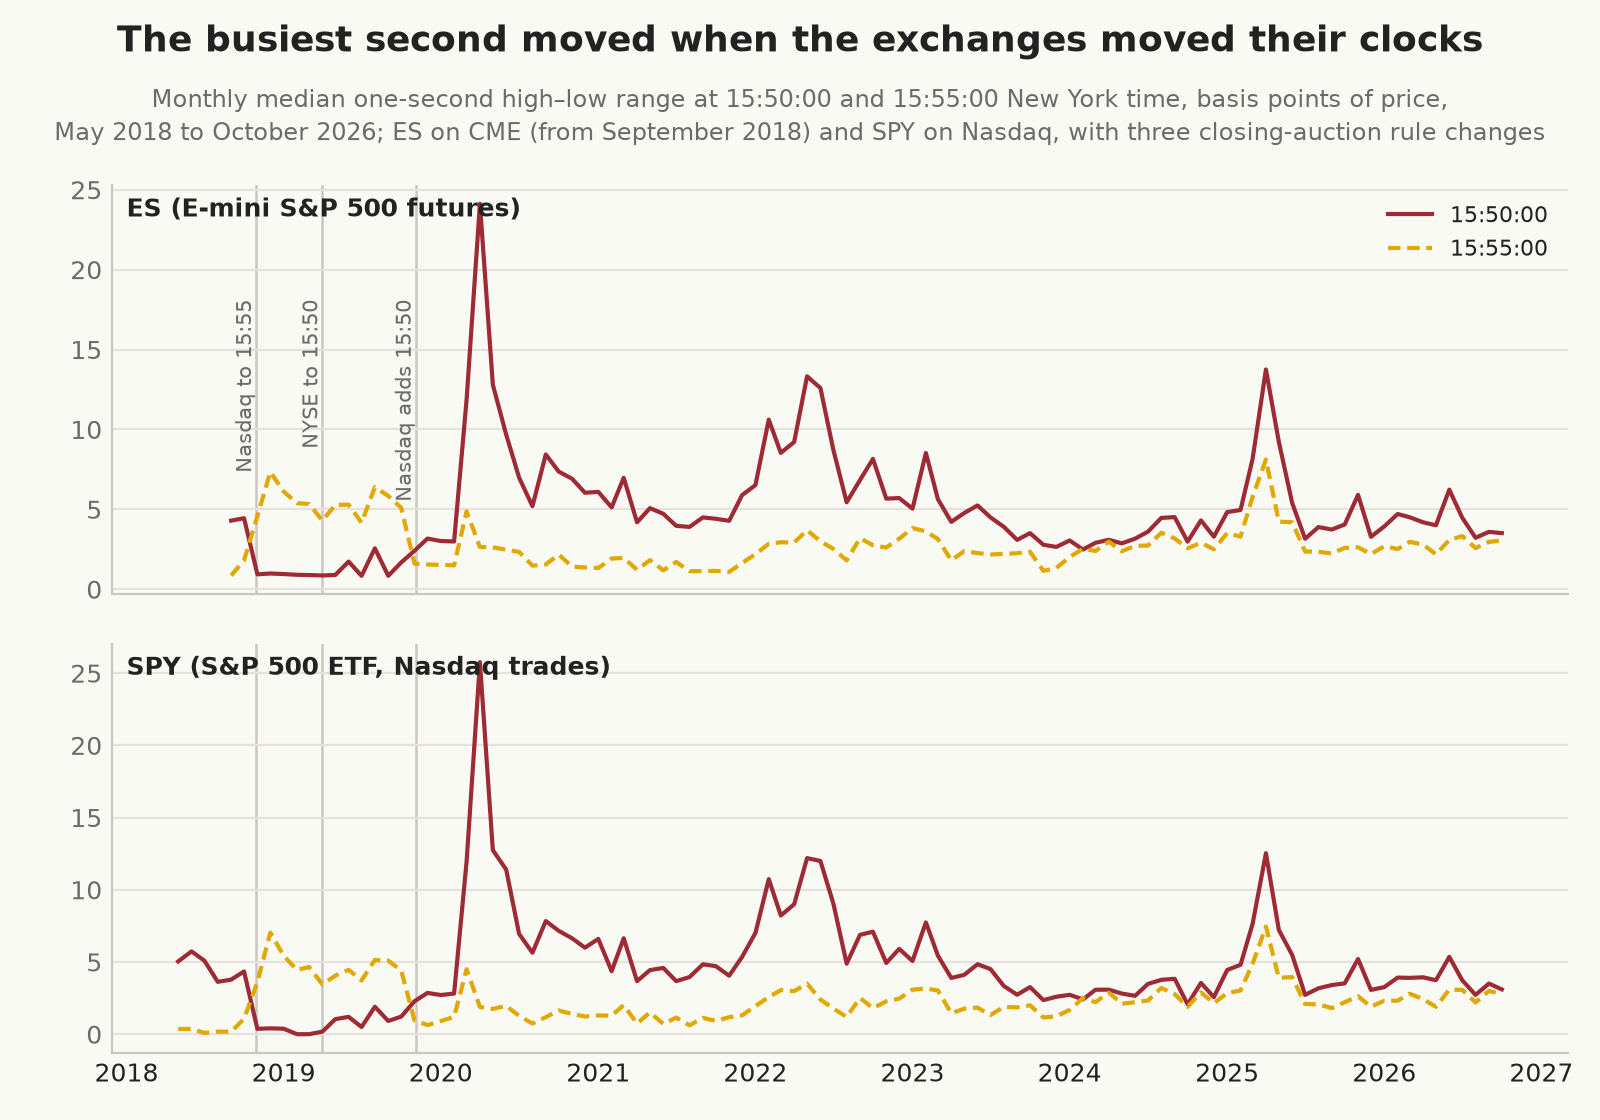
Before 29 October 2018 the burst came at 15:50:00, which was then Nasdaq’s cut-off. When Nasdaq moved the cut-off to 15:55, the burst moved with it, in the futures as well as the ETFs, and when Nasdaq added an early imbalance message at 15:50 on 4 November 2019, the bigger burst moved back. NYSE’s own change in April 2019 left no visible mark. The bursts have also grown: in the four index futures, the volume traded in the 15:55:00 second went from about five or six times an average quiet second in 2020 to between 31 and 40 times in 2026. Rounding a send time is expensive in those seconds, since a QQQ market order sent at 15:50:00 over the past year filled at least a basis point worse than the mid on 45% of occasions, against under 1% for one sent a few seconds off a round time. An exit near the close that’s been backtested from 2017 to 2026 has been run through three closing timetables, one of which lasted just over a year.
A fee came back
Costs can change overnight. Let’s look at the most recent example of this. The SEC’s Section 31 fee, which exchanges pass on to sellers of US stocks, was zero from 14 May 2025 and came back at $20.60 per million dollars of sales from trade date 2 April 2026. At SPY’s and QQQ’s prices that’s 1.3 to 1.5 cents a share sold, which is more than the one-cent spread the two ETFs had mostly traded on. Across the seven largest exchanges, the share of minutes with a one-cent spread fell from 78% before that day to 25% after it in QQQ, and from 83% to 43% in SPY. The size displayed at the best price roughly halved, and the ETFs’ volume fell by about 40%, while ES and NQ, which don’t pay the fee, carried on much as before.28
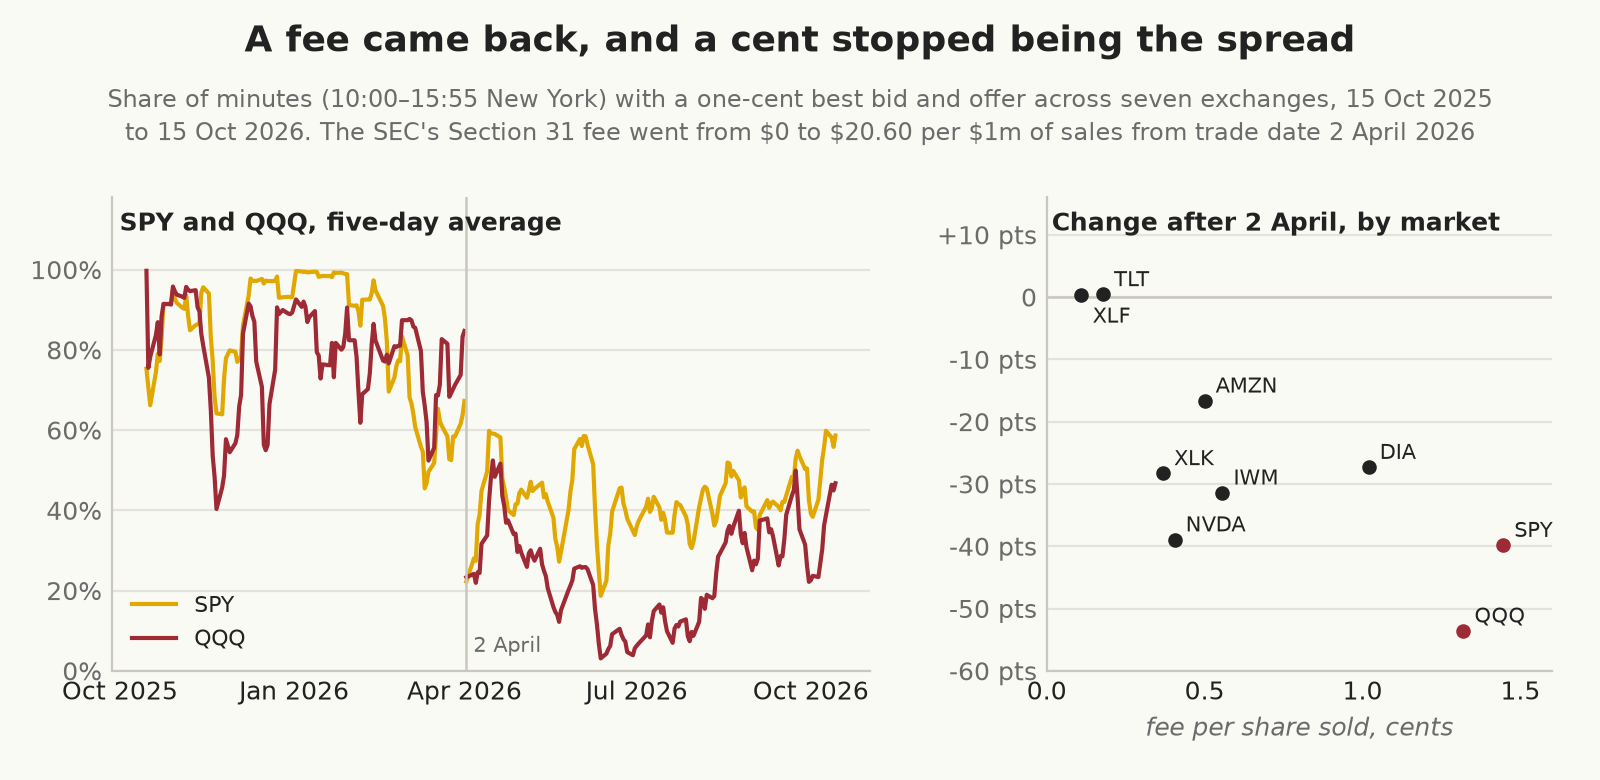
The markets where the fee per share is tiny, such as TLT and XLF, stayed a cent wide, which is what you’d expect if the fee is the cause. A cost model fitted to late 2025 understates what these ETFs have cost to trade since April. And the year it was fitted on was unusual in its own right, since the fee had been zero only since May 2025, and our quote data doesn’t reach back far enough to show what spreads looked like before that, so the “recent” data may be the odd one out.
A drift that may have come back
Not every change runs one way, and this example cuts against the rest of the post. Lucca and Moench found that from September 1994 to March 2011 US stocks rose an average of 49 basis points in the 24 hours before scheduled FOMC announcements.29 Kurov, Wolfe, and Gilbert extended the sample to December 2019 and found that the drift had essentially disappeared after 2015.30 We measured it on ES for every scheduled meeting from June 2010, from 13:00 Chicago time the day before to 11:15 on the statement day. That ends earlier than Lucca and Moench’s window, so that it closes before every statement time in our sample.
| period | meetings | mean, bp | median, bp | t | up | other days, mean bp |
|---|---|---|---|---|---|---|
| 2010–2015 | 44 | 4.3 | −3.2 | 0.47 | 39% | 4.5 |
| 2016–2020 | 39 | 18.4 | 8.1 | 2.29 | 62% | 5.2 |
| 2021–2026 | 46 | 19.9 | 12.1 | 1.72 | 59% | 2.6 |
In 2010–15, years of zero interest rates, there was no drift at all. Since 2016 the average has been about 19 basis points against about 4 on other days, and most of it arrives overnight, before the statement day’s open. That may be the drift returning with interest-rate uncertainty, which is Kurov and his co-authors’ explanation for its disappearance run in reverse, but it may just as well be noise. On their own years, 2016–19, our median is only 3.9 basis points; the 2016–20 average depends heavily on 5 November 2020, the statement day after the presidential election; and the 2021–26 figure has a t-statistic of 1.7 from 46 meetings. Even with every scheduled meeting for 16 years we can’t tell which, and that’s a useful warning in both directions, since “it’s come back” needs as much evidence as “it’s gone”.
The afternoon
Gao, Han, Li, and Zhou showed in 2018 that the market’s first half hour predicted its last half hour in SPY from 1993 to 2013, though they also noted that the predictability wasn’t stable.31 On ES the first half hour has been a weak predictor throughout. The day so far, from the previous close to 14:30 Chicago time, did better, and the rule of taking its direction for the last half hour earned a Sharpe ratio of 0.59 from 2010 to 2017 and 0.81 from 2018 to 2021, before costs. Since 2022 it has been −0.16, and it was negative in each of 2024, 2025, and 2026.
| period | correlation, day so far with last half hour | rule, bp/day | rule Sharpe |
|---|---|---|---|
| 2010–2017 | 0.11 | 0.87 | 0.59 |
| 2018–2021 | 0.07 | 2.10 | 0.81 |
| 2022–2026 | 0.01 | −0.25 | −0.16 |
2022 is when Cboe added Tuesday and Thursday SPX expiries, so that SPX options now expire every trading day, and zero-day options have been half or more of SPX volume since 2023. Baltussen, Da, Lammers, and Martens tied the late-day move across more than 60 futures markets to hedging by options dealers and leveraged ETFs, whose flows run with the day’s move when dealers are short gamma and against it when they’re long.32 The evidence on zero-day options in particular is mixed, though, and Dim, Eraker, and Vilkov found that dealers’ gamma from them doesn’t amplify volatility.33 We can’t prove the cause from under five years of one market, and the edge was small anyway; at about one basis point a day, a round trip in ES costs most of it.
What didn’t change
In every year since 2010, the overnight session set the full session’s high or low on 71–86% of days, and the overnight range was between 58% and 69% of the full session’s range. From 2013, when our volume measure starts, the day session’s share of front-month ES volume stayed between 79% and 85%. The cash session’s high or low was set in its first hour on 70–75% of days in every era, and about 60% of opening gaps were back at the previous 15:00 price by the cash close, a rate that hardly moved even for the largest gaps. By 2010 the extended session was long established, and none of these numbers has moved much since.
How can we use this knowledge when building strategies?
Date the structure. Build a dated register of the changes that could touch the strategy, in the same way that our session registry has to record that live cattle traded 97 hours a week in 2014 and 23 in 2016. For each market that means the trading venue (pit, side by side, or electronic), session hours, tick size, contract size, settlement, the commission regime and regulatory fees, the closing-auction timetable, circuit breakers and price limits, and the products that sit on top of it, such as weekly and daily options. Each row needs an effective date and a source. Most of the dates in this post took minutes to find, and yet very few backtests know any of them.
Measure the participants. Who’s on the other side changes faster than the rules do. The CFTC’s Traders in Financial Futures report splits open interest between dealers, asset managers, leveraged funds, and others every week back to June 2006, though the years before 2010 were backfilled. Exchange statistics give the share of micro contracts and of zero-day options, and the share of volume traded outside the day session. Each of those is a time series, and a break in any of them is a candidate break in the strategy, although the series need checking for breaks of their own first, as the CFTC’s change of units in May 2023 shows.
Measure the behaviour as well as the price. The quantities that matter are mostly second moments and timing: volatility and its clustering, day-to-day and intraday autocorrelation, the share of the day’s range set overnight, the size of opening gaps, how often a day’s high and low are both set in the first hour, and the intraday volume curve. Compute them by year, as we did above, and test for breaks with a method that chooses the dates for you, such as Bai and Perron’s.34 If a strategy feeds on one of them, its edge can’t be more stable than that quantity.
Split the backtest at the breaks. Use the structural dates as the boundaries, in place of decade ends or an arbitrary 70/30 line. Report the edge in each era separately with its own standard error, and test whether the eras differ. A strategy that only made money before decimalisation, or only in the pit era, or only before daily expiries, needs a reason to think that era is coming back.
Let the data choose the look-back. Repeat the test in our table for the strategy itself: at each year end, estimate next year’s or the next five years’ performance from expanding and from rolling windows, and see which forecasts better out of sample. Practitioners disagree about the default: Ernie Chan has written that he wouldn’t use data from before 2009 for most analysis, because of Reg NMS, decimalisation, leveraged ETFs, and high-frequency trading, while Robert Carver tested weighting recent years more heavily in his own system and found that it added nothing.35 Both can be right for different strategies, which is why the choice needs a test. If the full history wins, keep it, and if it loses, then the extra years are making the estimate worse.
Write down the mechanism, then test it. Every strategy implies a reason why someone pays you. State it, and then name the market feature it needs, whether that’s a cost that keeps others out, a participant who trades for reasons other than price, a session boundary, or a hedging flow, and check that feature’s own history. The day-to-day trend needed slow price discovery and high trading costs, and both have gone. Momentum needs investors who under-react and then chase, and they’re still here.
Use the old data for what it’s good at. A century of history is still the best record of what can go wrong: the size of drawdowns, how long they last, what happens to correlations in a panic, and what a 1929 or a 1987 or a 2008 does to a position. Use it to size risk and to stress-test, even when you don’t trust it to tell you the size of the edge.
Two smaller habits belong here too. Stops, targets, and costs written in ticks or points turn into different rules as the price moves, so write them as a fraction of recent range or of price, and re-fit costs whenever a fee, a tick size, or an auction rule changes. And be suspicious of your own enthusiasm for old data, because the years that flatter a short-term rule most are the ones with the highest costs and the stalest prices, which no backtest charges for properly.
What is coming
The next few years will add more breaks. Here’s some we already know about:
- US stocks, 23 hours a day. Nasdaq’s overnight session, 9 pm to 4 am Eastern, is due to open on Sunday 6 December 2026, after the SEC approved it in April. NYSE Arca, Cboe EDGX, and MEMX have approvals of their own, and the plumbing has followed, with the SIPs that publish consolidated prices, NSCC’s clearing hours, the LULD bands, and FINRA’s trade reporting all extended to the new hours.36 After that date, anyone building a daily equity bar has to decide what its open and close mean, which is the problem Globex gave futures bars and one that futures traders are still cleaning up after.
- Futures around the clock. CME’s crypto futures have traded 24/7 since 29 May 2026, with weekend trades carrying Monday’s trade date, and in June 2026 the CFTC asked for comment on extending 24/7 trading to other futures.37 A Monday daily bar that contains Saturday’s trading is a new kind of bar.
- Smaller contracts and shorter options. E-nano equity futures, a hundredth of an E-mini, launched on 24 August 2026, and the zero-day share of SPX options is still rising. Both bring in participants whose holding periods are measured in hours.
- Price increments. The SEC’s 2024 rule to halve the minimum tick for the most tick-constrained stocks, and to cut exchange access fees, has been delayed twice and is now due in November 2027. In June 2026 the SEC also proposed rescinding Reg NMS’s trade-through rule.38 A tick-size change is the same kind of change as the ones in 1997 and 2001.
- Settlement and clearing. US Treasury cash trades must be centrally cleared from 31 December 2026, and repo from 30 June 2027, while Europe and the UK move to T+1 settlement on 11 October 2027.39
- Tokenised shares and event contracts. The SEC approved Nasdaq’s rule for trading tokenised versions of listed shares in March 2026, and in September it granted a limited exemption for trading tokenised stocks on blockchains. The CFTC has been writing rules for prediction markets all year.40 Neither market is large yet, but each opens a venue for the same risk outside the hours and rules of the existing one.
Caveats
The century tests use CRSP indices and the Fama–French factors, which are paper portfolios with no costs, no shorting constraints, and daily rebalancing no one could have carried out in 1930. That flatters the old-data results, which look better on paper than they could have been in practice, and makes the follow-yesterday figures before 1975 an upper bound.
The window test uses annual origins with overlapping forecast periods, so its hit rates and errors describe the data and shouldn’t be read as test statistics. The break search runs on one value per year and finds break dates to within a few years. We chose the rules, the look-backs, and the horizons once and didn’t tune them.
The ES results cover 16 years of one contract, and the last period of the intraday momentum split has under five years of data, from 2022. They show that the effect changed, and they can’t tell us why.
The closing-second results come from one-second bars from 2018 and tick data for the past year, and the fee comparison covers one year of quotes, a little under six months on either side of 2 April 2026, so it shows the break without saying how long it will last.
Finally, “the market changed” can be used to excuse any bad run. The test we’re arguing for is a narrower one: name the change, date it, and show that the strategy’s performance breaks there and not somewhere else.
Conclusion
Even the calendar moved under our data. Until 1952 the NYSE traded on Saturdays, and the first draft of this post annualised the 1930s as if it hadn’t, which understated that decade’s return by about a sixth. Nothing flagged it because the tables looked normal. We only found it when looking into whether we’d correctly accounted for returns in French’s data.
For the trader in a rough patch, the useful question is what the strategy needed from the market and whether the market still provides it. Momentum’s rough patches passed in 11 of the 12 cases we found, and follow-yesterday’s didn’t, and the century of data on its own couldn’t have told you which was which. The pre-FOMC drift is the awkward case. It may track uncertainty about interest rates, which is how Kurov and his co-authors explained its disappearance, and that would fit both its absence in the zero-rate years of 2010 to 2015 and its return since 2016. Even so, 16 years of meetings can’t tell us whether it really has come back.
The next break is already locked in. When US stocks start trading 23 hours a day on 6 December 2026, a daily equity bar will have to say which trading day it means, and a backtest that spans that date could be mixing two markets.
Sources
- Kenneth R. French, Data Library: Fama/French 3 Factors [Daily], Momentum Factor (Mom) [Daily], and Portfolios Formed on Size [Daily], built from the 202608 CRSP database, https://mba.tuck.dartmouth.edu/pages/faculty/ken.french/data_library.html.
- Data: CME Globex ES and MES one-minute and session bars (Databento), June 2010 to 16 October 2026, from the marketfeed archive; one-second bars for ES and SPY from 2018, and each exchange’s best bid and offer for 14 US stocks and ETFs from October 2025, as described in the two closing-second posts; and the CFTC’s Traders in Financial Futures reports.
- The academic and regulatory sources are in the footnotes.
Andrew W. Lo, “The Statistics of Sharpe Ratios”, Financial Analysts Journal 58(4), 2002, 36–52. The eighteen-year and century figures are our arithmetic from his IID formula. ↩︎
Eugene F. Fama and Kenneth R. French, “The Value Premium”, Review of Asset Pricing Studies 11(1), 2021, 105–121. The figures are for the market value portfolio; the test for no change across all six portfolios has a p-value of 0.87. ↩︎
Brian Hurst, Yao Hua Ooi, and Lasse Heje Pedersen, “A Century of Evidence on Trend-Following Investing”, Journal of Portfolio Management 44(1), 2017, 15–29; decade figures from AQR’s 2014 working version, January 1880 to December 2013. ↩︎
Elroy Dimson, Paul Marsh, and Mike Staunton, UBS Global Investment Returns Yearbook 2026 (summary edition), UBS, 2026. ↩︎
Antti Ilmanen, Ronen Israel, Rachel Lee, Tobias J. Moskowitz, and Ashwin Thapar, “How Do Factor Premia Vary Over Time? A Century of Evidence”, Journal of Investment Management 19(4), 2021. They did find lower returns outside the original samples, which they read as overfitting, but no further fall after publication. ↩︎
M. Hashem Pesaran and Allan Timmermann, “Selection of Estimation Window in the Presence of Breaks”, Journal of Econometrics 137(1), 2007, 134–161. ↩︎
Securities Exchange Act and the SEC’s start: United States Government Manual, SEC entry. Gold: Federal Reserve History, “Gold Reserve Act of 1934”. S&P 500 launch and back-tested history: S&P Dow Jones Indices, S&P 500 Through History (2023). CRSP coverage: as in the French footnote. May Day: SEC Rule 19b-3, effective 1 May 1975 (SEC Historical Society). CME first trading days: CME Group, Products: First Day of Trading. Circuit breakers: SEC, Trading Analysis of October 27 and 28, 1997. 1997 tick size: SEC, Report to Congress on Decimalization (July 2012), and Goldstein and Kavajecz (2000). Order handling rules: FINRA Notice to Members 97-49. Decimals: SEC order of 8 June 2000, in the same report. Reg NMS: SEC press release 2007-9; uptick repeal: SEC Release 34-55970. Flash crash: CFTC and SEC staff, Findings Regarding the Market Events of May 6, 2010 (2010); LULD: SEC Release 34-67091 and the SEC DERA LULD white paper. ES hours: CME, Changes to CME Globex Trading Hours and Daily Price Limits (2012), and CME Globex Notices, 21 June 2021. Pit closures: CME Group press releases of 4 February 2015 and 4 May 2021. Micro E-mini: CME Group, After Five Years, Micro Equity Futures Still Gaining Steam (2024). Commissions: Schwab and TD Ameritrade press releases of October 2019, and E*Trade’s release filed with the SEC. SPX expiries: Cboe, Cboe to Add Tuesday and Thursday Expirations for SPX Weeklys Options (13 April 2022). Closing-auction changes: Nasdaq Equity Trader Alerts 2018-82 and 2019-66, SEC Release 34-87198, and NYSE, Market on Close/Limit on Close Cutoff Time Change (1 April 2019). CFTC units: our own analysis of the Traders in Financial Futures reports, as in the footnote on positioning. Section 31: SEC fee rate advisories 2025-2 and 2026-2, and Nasdaq Options Trader Alert 2026-14. T+1: SEC Release 34-96930. Crypto: CME Group press release, 1 June 2026. E-nano: CME Group press release, 3 August 2026. ↩︎
2016 and 2023: Kristijan Todorov and Grigory Vilkov, “What could explain the recent drop in VIX?”, BIS Quarterly Review, March 2024. 2025: Cboe, Cboe Global Markets Reports Trading Volume for December and Full Year 2025, 6 January 2026. July 2026: Cboe, July 2026 volume release, 5 August 2026. Retail share: Cboe Insights, SPX 0DTE Options Jump to Record 62% Share in August, 2 September 2025. ↩︎
CME Group, CME Group Reports Record Annual ADV of 28.1 Million Contracts in 2025, 5 January 2026; E-nano: CME Group press release, 3 August 2026. Micro share is by contract count; a micro is a tenth of an E-mini, so its share of notional is far smaller. ↩︎
There is no official figure. Bloomberg Intelligence’s estimates (about 15% in 2019, a peak near 24% in 2021) are quoted in Webull’s SEC filings; Jefferies’ 2025 estimate of over 20% was reported by Sherwood News on 9 December 2025. ↩︎
Investment Company Institute, 2026 Investment Company Fact Book, chapter 2. ↩︎
Joel Hasbrouck, “Intraday Price Formation in U.S. Equity Index Markets”, Journal of Finance 58(6), 2003, 2375–2400. ↩︎
Holbrook Working, “Note on the Correlation of First Differences of Averages in a Random Chain”, Econometrica 28(4), 1960, 916–918. Shiller’s description of his price series is at https://shillerdata.com/. The CFTC’s caveat on backfilled Traders in Financial Futures history is in its explanatory notes for that report. ↩︎
Philippe Jorion and William N. Goetzmann, “Global Stock Markets in the Twentieth Century”, Journal of Finance 54(3), 1999, 953–980. ↩︎
Our own analysis of the CFTC’s Traders in Financial Futures reports, 2010–2026, futures and options combined, as described in Why market data is harder than you think. The consolidation formulas are inferred from the published figures, not from a CFTC statement. ION: CFTC statements of 2 and 10 February 2023 and release 8662-23 of 16 February 2023. ↩︎
Kenneth R. French Data Library, daily three factors, momentum, and size portfolios, built from the 202608 CRSP database. CRSP’s daily coverage is NYSE from 1926, AMEX from 2 July 1962, and Nasdaq from 14 December 1972. The market return is the value-weighted excess return plus the one-month bill rate. ↩︎
John Y. Campbell, Sanford J. Grossman, and Jiang Wang, “Trading Volume and Serial Correlation in Stock Returns”, Quarterly Journal of Economics 108(4), 1993, 905–939. ↩︎
Guido Baltussen, Sjoerd van Bekkum, and Zhi Da, “Indexing and Stock Market Serial Dependence Around the World”, Journal of Financial Economics 132(1), 2019, 26–48. ↩︎
Andrew W. Lo and A. Craig MacKinlay, “Stock Market Prices Do Not Follow Random Walks: Evidence from a Simple Specification Test”, Review of Financial Studies 1(1), 1988, 41–66. Their headline result was weekly autocorrelation; we take their publication as the date the market’s short-horizon trend became common knowledge. ↩︎
For each calendar year from 1927 to 2026 (2026 to August), we computed the lag-1 autocorrelation of daily market returns, then found the segmentation into flat pieces of at least five years that minimises the sum of squared deviations, for zero to five breaks, and chose the number of breaks by BIC. This is a simplified version of the Bai and Perron approach in the next section. ↩︎
FINRA (then NASD) Notice to Members 97-49 on the order handling rules; Michael A. Goldstein and Kenneth A. Kavajecz, “Eighths, Sixteenths, and Market Depth: Changes in Tick Size and Liquidity Provision on the NYSE”, Journal of Financial Economics 56(1), 2000, 125–149; SEC, Report to Congress on Decimalization, July 2012. ↩︎
R. David McLean and Jeffrey Pontiff, “Does Academic Research Destroy Stock Return Predictability?”, Journal of Finance 71(1), 2016, 5–32. ↩︎
Tarun Chordia, Avanidhar Subrahmanyam, and Qing Tong, “Have Capital Market Anomalies Attenuated in the Recent Era of High Liquidity and Trading Activity?”, Journal of Accounting and Economics 58(1), 2014, 41–58. ↩︎
Kenneth R. French, “Stock Returns and the Weekend Effect”, Journal of Financial Economics 8(1), 1980, 55–69. Rolf W. Banz, “The Relationship Between Return and Market Value of Common Stocks”, Journal of Financial Economics 9(1), 1981, 3–18. Eugene F. Fama and Kenneth R. French, “The Cross-Section of Expected Stock Returns”, Journal of Finance 47(2), 1992, 427–465. Narasimhan Jegadeesh and Sheridan Titman, “Returns to Buying Winners and Selling Losers”, Journal of Finance 48(1), 1993, 65–91. ↩︎
G. William Schwert, “Anomalies and Market Efficiency”, in G. Constantinides, M. Harris, and R. Stulz (eds.), Handbook of the Economics of Finance, vol. 1B (Elsevier, 2003), table 3. ↩︎
Heiko Jacobs and Sebastian Müller, “Anomalies Across the Globe: Once Public, No Longer Existent?”, Journal of Financial Economics 135(1), 2020, 213–230. ↩︎
Vincent Bogousslavsky and Dmitriy Muravyev, “Who Trades at the Close? Implications for Price Discovery and Liquidity”, Journal of Financial Markets 66, 2023. ↩︎
From the ETF post: minute snapshots of each exchange’s best bid and offer from 10:00 to 15:55 on Nasdaq, NYSE Arca, NYSE, Cboe BZX, Cboe EDGX, IEX, and MEMX, 15 October 2025 to 15 October 2026, with consolidated daily volume. IEX reported the same widening from TAQ data in J. Ramsay and S. Stevens, “The Section 31 Fee Rollercoaster: How to Make for a Smoother Ride”, 17 June 2026. ↩︎
David O. Lucca and Emanuel Moench, “The Pre-FOMC Announcement Drift”, Journal of Finance 70(1), 2015, 329–371. Scheduled meeting dates are from the Federal Reserve’s FOMC calendars. ↩︎
Alexander Kurov, Marketa Halova Wolfe, and Thomas Gilbert, “The Disappearing Pre-FOMC Announcement Drift”, Finance Research Letters 40, 2021. ↩︎
Lei Gao, Yufeng Han, Sophia Zhengzi Li, and Guofu Zhou, “Market Intraday Momentum”, Journal of Financial Economics 129(2), 2018, 394–414. Carlo Rosa, “Understanding Intraday Momentum Strategies”, Journal of Futures Markets 42(12), 2022, found that the predictability disappears out of sample. ↩︎
Guido Baltussen, Zhi Da, Sten Lammers, and Martin Martens, “Hedging Demand and Market Intraday Momentum”, Journal of Financial Economics 142(1), 2021, 377–403. ↩︎
Chukwuma Dim, Bjørn Eraker, and Grigory Vilkov, “0DTEs: Trading, Gamma Risk and Volatility Propagation”, SSRN 4692190, 2024. ↩︎
Jushan Bai and Pierre Perron, “Estimating and Testing Linear Models with Multiple Structural Changes”, Econometrica 66(1), 1998, 47–78, and “Computation and Analysis of Multiple Structural Change Models”, Journal of Applied Econometrics 18(1), 2003, 1–22. ↩︎
Ernie Chan, “Time series analysis and data gaps”, 2 July 2015, on his blog; Robert Carver, “Fitting with: exponential weighting, alpha and the kitchen sink”, 6 March 2024, on his blog Investment Idiocy. ↩︎
SEC Release 34-105199 (10 April 2026) approving Nasdaq’s 23-hour trading; later approvals and the SIP, NSCC, LULD, and FINRA changes as summarised in WilmerHale, 23x5 Trading Comes to US Exchanges: What Firms Should Know Before Launch, 29 September 2026. ↩︎
CME Group press release, 1 June 2026, on the launch of 24/7 cryptocurrency futures and options; CFTC request for comment on 24/7 trading, Federal Register, 25 June 2026. ↩︎
SEC Chairman Paul Atkins, statement on minimum pricing increments and access fee caps, 11 June 2026, and SEC Release 34-105656. ↩︎
SEC Commissioner Mark Uyeda, statement on Treasury clearing implementation, 7 August 2026; Regulation (EU) 2025/2075; FCA, 13 August 2026. ↩︎
SEC Release 34-105047 (18 March 2026) on Nasdaq’s tokenised securities; SEC Release 34-106402 (17 September 2026); CFTC advance notice of proposed rulemaking on event contracts, 16 March 2026, and proposed rule, 12 June 2026. ↩︎