Looking beyond price for signals
Another transformation of OHLCV bars can make existing information easier for a model to use. But, it can’t supply an independent measurement of demand, inventories, or positioning. External data can supply those measurements, but prices may already reflect everything useful in them.
The reason to collect more data is to be able to answer questions not addressed by simple price bars alone. Does gas-fired electricity generation help forecast natural-gas storage changes? Do export commitments help anticipate revisions to a crop report? Could airport passenger counts contribute to research on fuel demand in the oil market?
Marketfeed, the archive behind our trading platform, collects about 750 government and regulatory series, alongside futures-options statistics and news. Some are conventional fundamental data; others are alternative data. The archive has given us more questions to investigate, along with some uncomfortable discoveries about the histories we thought we had.
Questions public data could help answer
Public sources give us several questions to try, each tied to something the publisher measures:
| Source | What it provides | A question to test |
|---|---|---|
| EIA: gas storage, electricity | Storage changes, electricity demand, and generation by fuel | Does weather-adjusted gas-fired generation improve a seasonal storage forecast? |
| USDA: WASDE, export sales | Monthly supply-and-use forecasts and weekly export commitments | Do export commitments help anticipate changes to the monthly forecast? |
| NOAA and the US Drought Monitor | Degree days (how far a day’s mean temperature falls below or rises above 65°F, a gauge of heating or cooling demand), weather forecasts, and drought conditions | Do regional weather anomalies add information about energy demand or crop conditions? |
| CFTC Commitments of Traders | Positions by category of trader | Does a trend rule behave differently near extremes of managed-money positioning? |
| Daily Treasury Statement | Government cash flows, including withheld taxes | Does calendar-adjusted tax growth improve an estimate of wage income? |
| FINRA short interest | Outstanding short positions | Does changing short interest add information beyond price and volatility? |
The question we’re studying may be broader than the measurement a publisher provides. Withheld taxes reflect earnings, tax rules, and payment calendars; they aren’t a count of jobs. Short interest measures positions, whereas daily short-sale volume measures trading activity. Passenger throughput leaves out aircraft type, flight distance, and load factors, all of which matter to fuel use.
There’s no contract with public data providers
There’s a general understanding with market data providers that shifting the ground under a trader’s or researcher’s feet should be an exception, not a rule. And if they do change it, the good ones will let you know. This is not the case with publicly available data sources.
For example, we might expect that data such as TSA’s daily passenger counts should be reasonably stable. But, across the 294 eligible dates in 2020, the median increase from the earliest archived TSA passenger counts to the later stored values was 5.9%. In extreme cases, the revisions were up to 31% higher. It is left as an exercise for the consumer of this data to detect and then manage these changes. To be fair, the TSA does at least acknowledge that they may change the data; they just don’t make it easy to work out when they’ve done it!
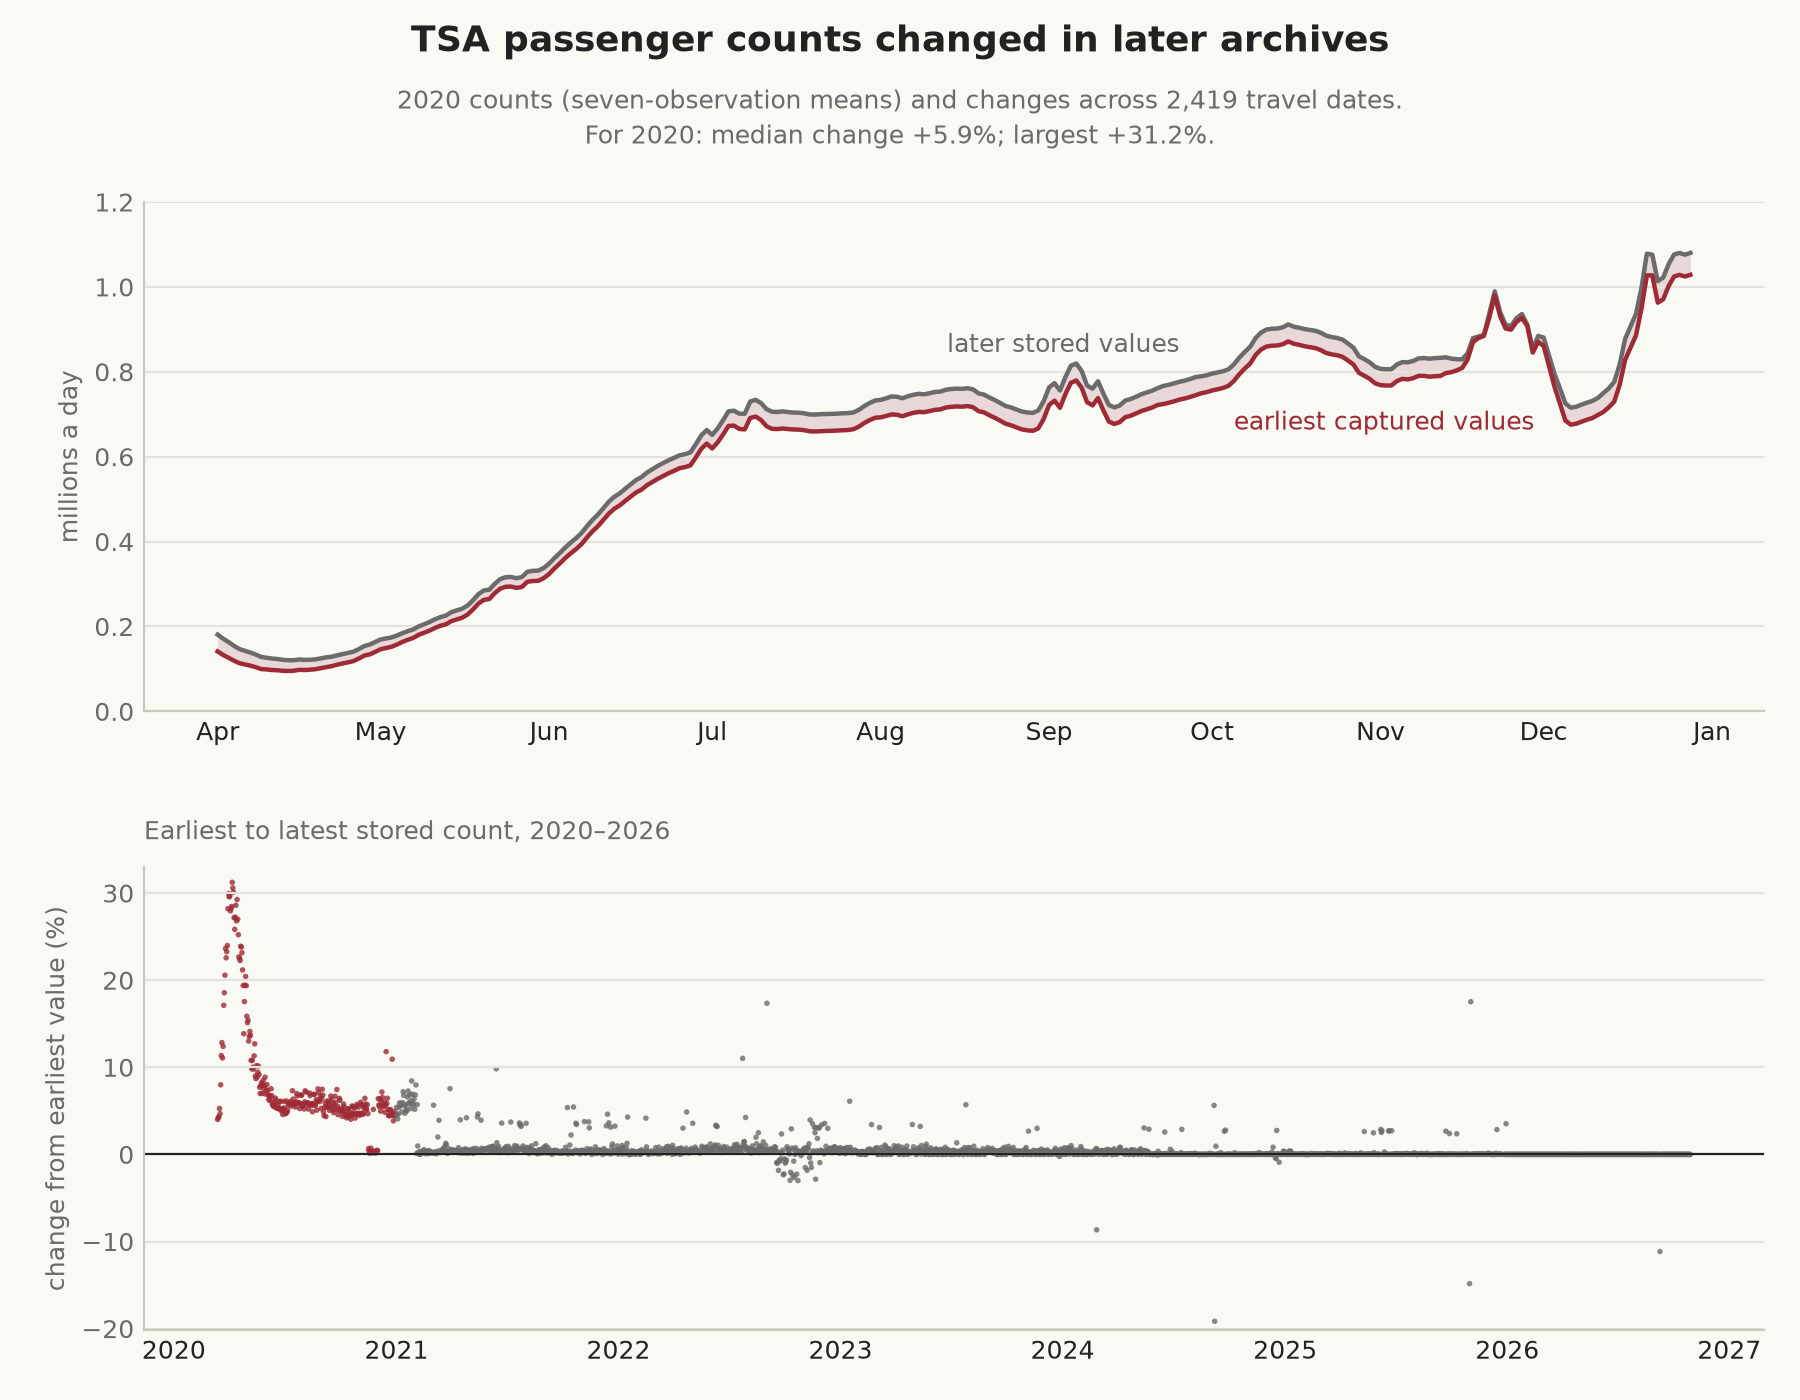
For travel on 1 June 2020, the public archive provides a pair readers can inspect:
| TSA page capture (UTC) | Count for 1 June 2020 |
|---|---|
| 2 June 2020, 12:54:49 | 353,261 |
| 6 January 2024, 02:48:53 | 379,146 |
An illustrative rule might act when the daily count exceeds 370,000. The later value crosses that threshold; the earlier value doesn’t. Moving today’s revised value to the old release date would still give the rule information it didn’t have.
Our stored earlier row is assigned 9 am New York time on 2 June from the release schedule. The first capture above already shows the count at 08:54:49 local time, so the stored time is an estimate. Each capture establishes availability by that instant; neither dates the exact publication nor the revision. The earliest surviving copy may itself contain a revision (but we’re probably just going to have to live with that if it has happened, since we’ve got no way to know.)
The dated source extracts record those pages and their table rows. The two stored vintages, comparison data, and methods let readers reproduce the arithmetic; this one source check doesn’t authenticate the whole reconstruction. The 370,000 threshold was chosen to expose the difference, without a return series or a strategy test.
ALFRED preserves historical versions of many economic series, though coverage and release-time precision need checking.1 Where old versions are missing, a new collection can at least preserve future releases. Local copies also help when access contracts: FRED’s ICE BofA high-yield spread is now limited to three years of history.2
A possible first project: forecasting gas storage
For a first experiment, we might want to test whether weather and gas-fired generation improve a forecast of the EIA’s weekly storage change. The report normally arrives on Thursday at 10:30 am Eastern; a published schedule advises the holiday exceptions.
| Decision | Proposed specification |
|---|---|
| Target | The Lower 48 weekly net change in working gas, in billion cubic feet, as initially published in the EIA report. |
| Forecast time | 9 am New York time on the scheduled release date, using only data available by then. |
| Baseline | The average initially reported change for the same week of the year over the preceding five years. |
| Added inputs | Heating and cooling degree days and gas-fired generation for the reporting week. |
| Augmented forecast | The baseline plus a linear regression estimate of its error from the added inputs, fitted only on earlier releases. |
| Comparison | Both forecasts recorded for the next 52 eligible releases, with the specification fixed in advance. |
| Measure | Mean absolute error in billion cubic feet for each forecast, and the difference between them. |
Predicting the initial announcement and predicting the subsequently revised economic quantity are different tasks, with different target values. The EIA’s revision records help identify changed estimates. Here the target would remain the initially published change; later revised storage history, or differences between today’s historical stock levels, could give us a different quantity.
The methods set out the full specification, including how much history the regression would need and how incomplete weeks would be handled. A trading test would come later as a separate step, with a measure of market expectations, an executable entry time, and transaction costs.
How much evidence would the test provide?
The comparison would produce 52 weekly errors for each forecast. If we carried each storage report into minute bars, then the data would gain thousands of rows but still hold only 52 observations of what the reports contain. Trying hundreds of series also creates many opportunities to find accidental patterns. A record of the candidates tried would put a promising result in context, while evaluation on later releases could test whether it held up.
The first result would be the two error measures, the weekly errors behind them, and a count of skipped releases. Although we haven’t run that comparison, we have checked the archive itself, and a single download holds the methods and chart data behind the figures in this article.
When the information was available
A report can describe last Friday, arrive this Thursday, and reach a collector several minutes later. Its observation period, publication time, and receipt time refer to different events. A simulation of the collection system would use receipt times; a study of earlier history would depend on publication evidence and an allowance for collection and processing.
The availability chart combines recorded timestamps with release-calendar reconstruction. Fourteen of its 20 series rely entirely on estimates; about 80% of all observations use estimated timestamps. It isn’t a measurement of actual delivery latency across 20 feeds.
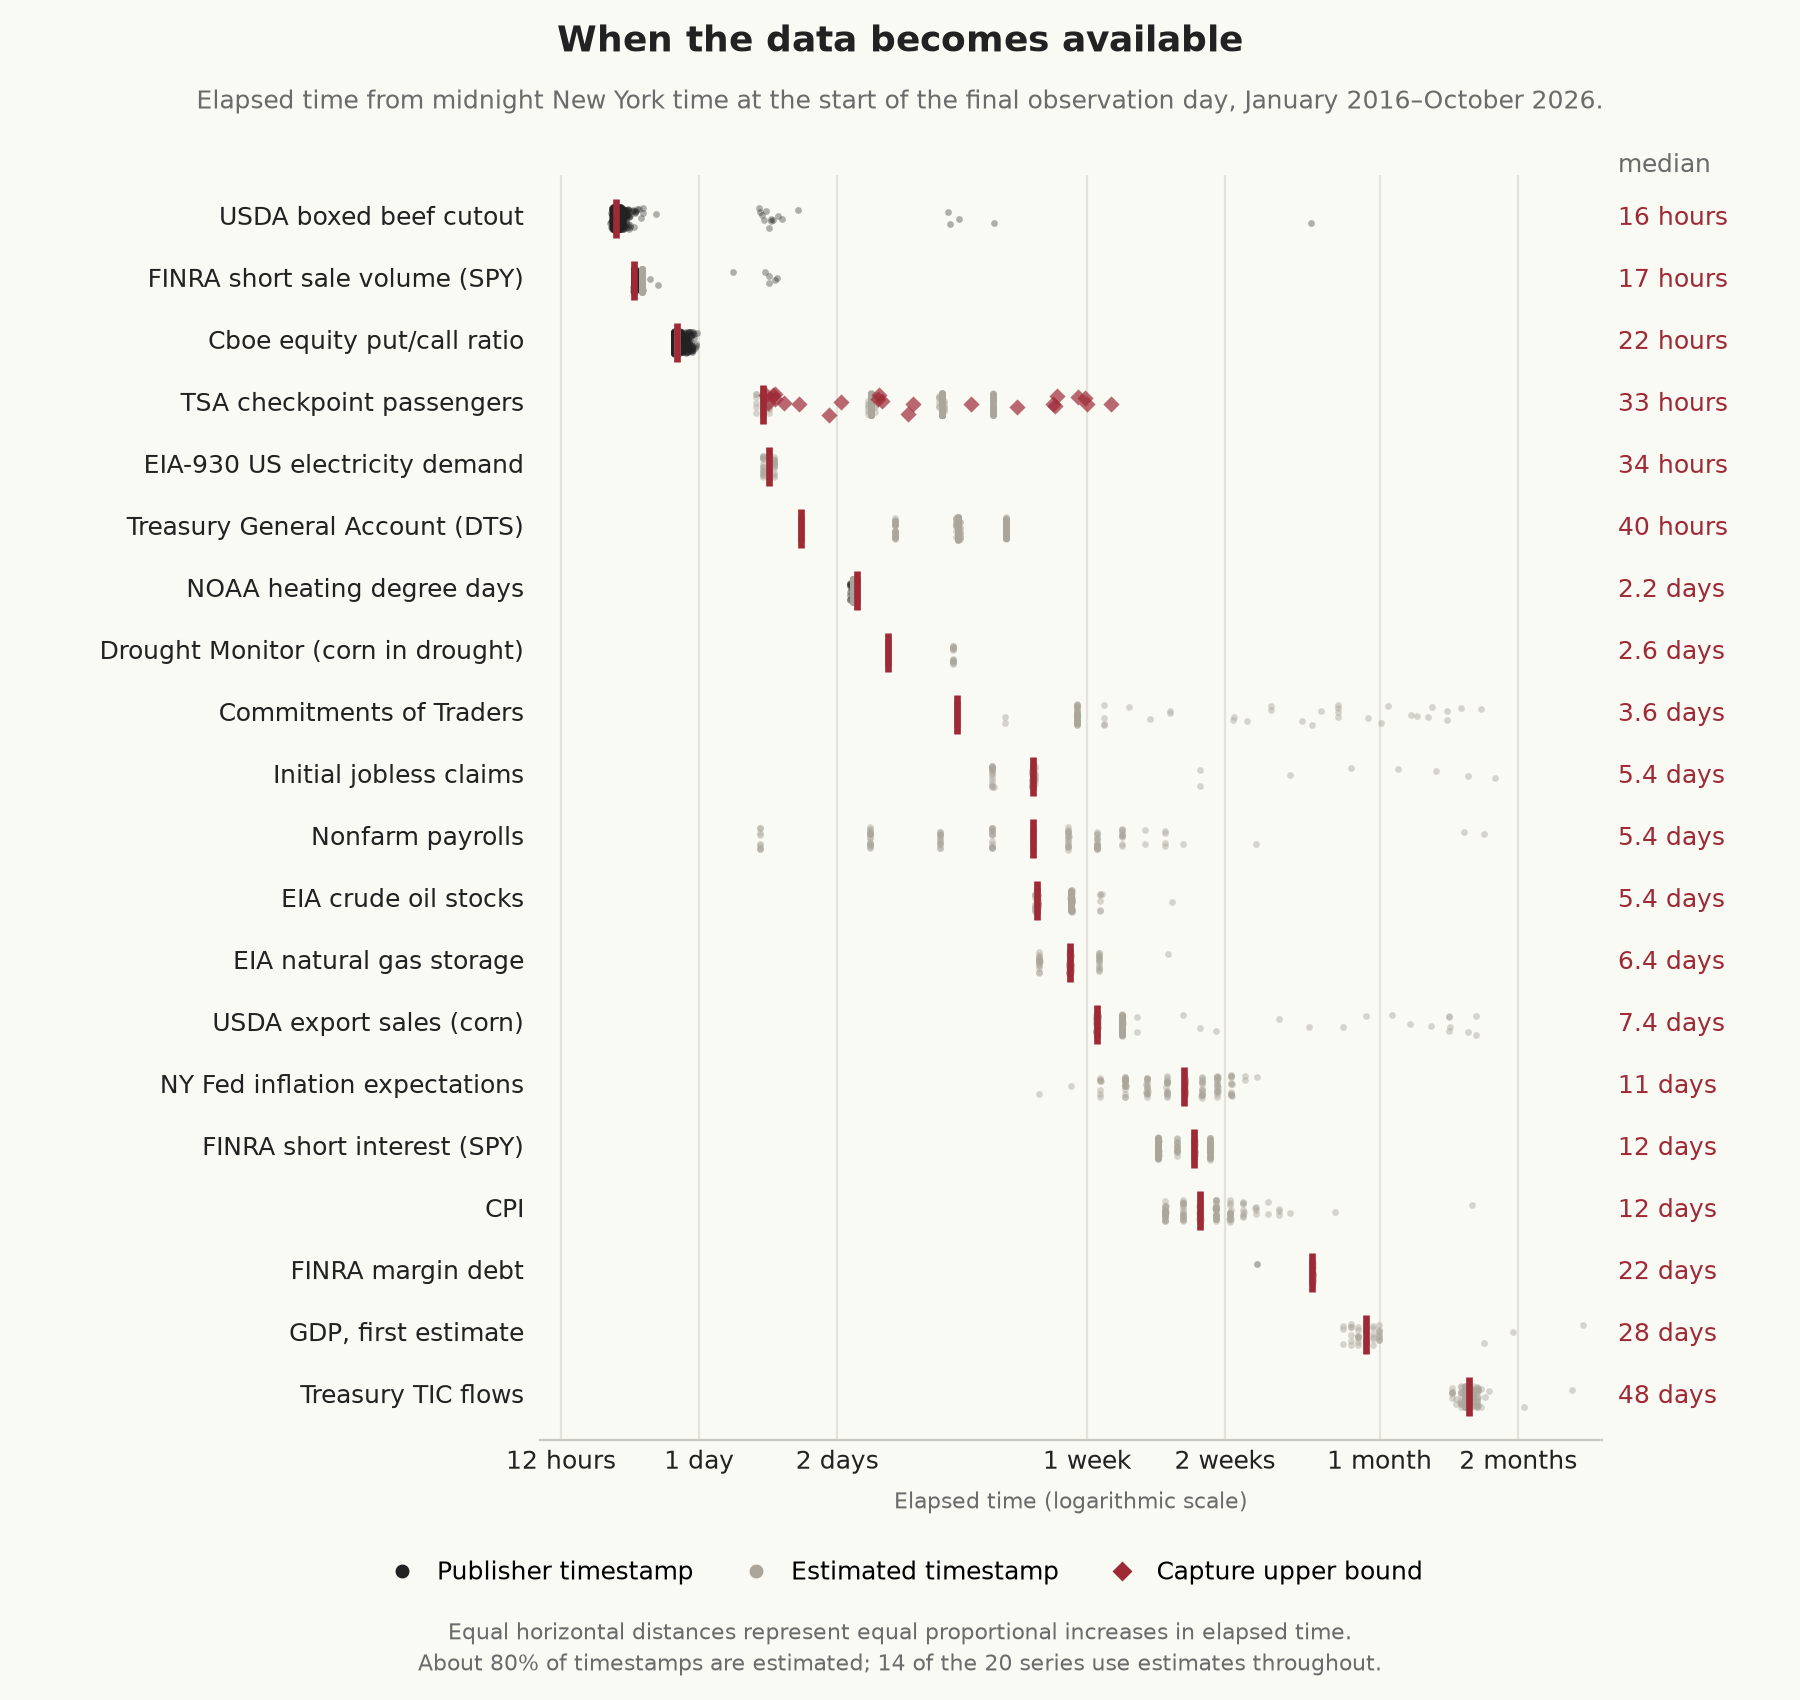
The clock starts at midnight New York time on the last observation day. For an ordinary day without a daylight-saving change, a reported 33-hour lag means:
| Local time | Hours from the chart’s starting point |
|---|---|
| Monday 00:00: observation day starts | 0 |
| Tuesday 00:00: observation day ends | 24 |
| Tuesday 09:00: scheduled release | 33 |
That’s nine hours after the day ended. A capture marker supplies an upper bound on when a value became public; an estimated marker may use a documented release date with an assumed hour. The summary download counts each evidence type, and the methods explain why 440 markedly late first TSA captures were excluded.
The USDA’s report for the week ending 20 December 2018 is dated 31 January 2019, after the government shutdown (archived PDF, as the original link currently returns an error). A rule saying “the following Thursday” would put it on 27 December. Across the 2013, 2018–19, and 2025 shutdowns, our rule-based stamps put 29 weeks of each of ten export-sales series before publication; we replaced them with documented dates.
At each decision, a simulation would use the latest version available by that instant. A weekly value can carry forward after receipt, but it cannot be filled backwards before release. If a report arrives inside a 10–11 am bar, it can’t support an entry at that bar’s opening price. Time zones, daylight-saving changes, and exchange holidays affect that timing. Where historical timestamps were uncertain, a comparison allowing more delay could reveal how much the result depended on those estimates.
Collecting and maintaining the history
Once we had identified sources to collect, retrieving complete histories brought a different set of problems. One large request to the USDA’s livestock service stopped at 100,000 rows without looking incomplete; a malformed NOAA map file interrupted another historical backfill. Even a successful HTTP response can contain a maintenance page, so the response alone doesn’t tell us whether the requested data has arrived.
Checks on row counts, date coverage, required fields, and missing intervals help us assess what a download contains. Where a service limits request size, the history could be collected page by page or divided into smaller date ranges.
The publisher’s documentation would be a starting point for understanding units, geography, frequency, and revisions. An archive could keep the original responses with their URLs or queries, retrieval times, and hashes, alongside the cleaned series. With conversions and instrument mappings recorded too, a revised parser could process the same inputs. A missing observation isn’t automatically zero, and a unit change isn’t a sudden jump in economic activity.
There can also be questions about what a historical series actually represents, even when all its rows have arrived. The CFTC’s Socrata data labels code 099741 “EURO FX” back to 1986, when the contract was the Deutsche Mark. Someone researching the euro would be looking at a different currency in that early part of the history.
Routine collection would involve retries and checks for overdue releases. Revisiting earlier periods could reveal revisions; retaining those versions with their timing evidence would preserve what the collector had seen. Definition changes can also affect the use of a series. A move from weekly to twice-weekly publication changes the meaning of a lookback counted in rows, as we examined in the CFTC’s planned CoT schedule change.
The government series carry no access fee. Our futures-options statistics use an existing CME subscription; engineering time, storage, and maintenance still belong in the budget.
Turning text into something testable
For a commodity researcher, a news measure might track production interruptions or export restrictions. Finding that coverage involves distinguishing reports about the market from articles that merely contain its name. Our archive retrieves GDELT keyword matches through BigQuery, screens them with rules, and uses a language model to classify the remaining matches from headlines, topic tags, and snippets.3
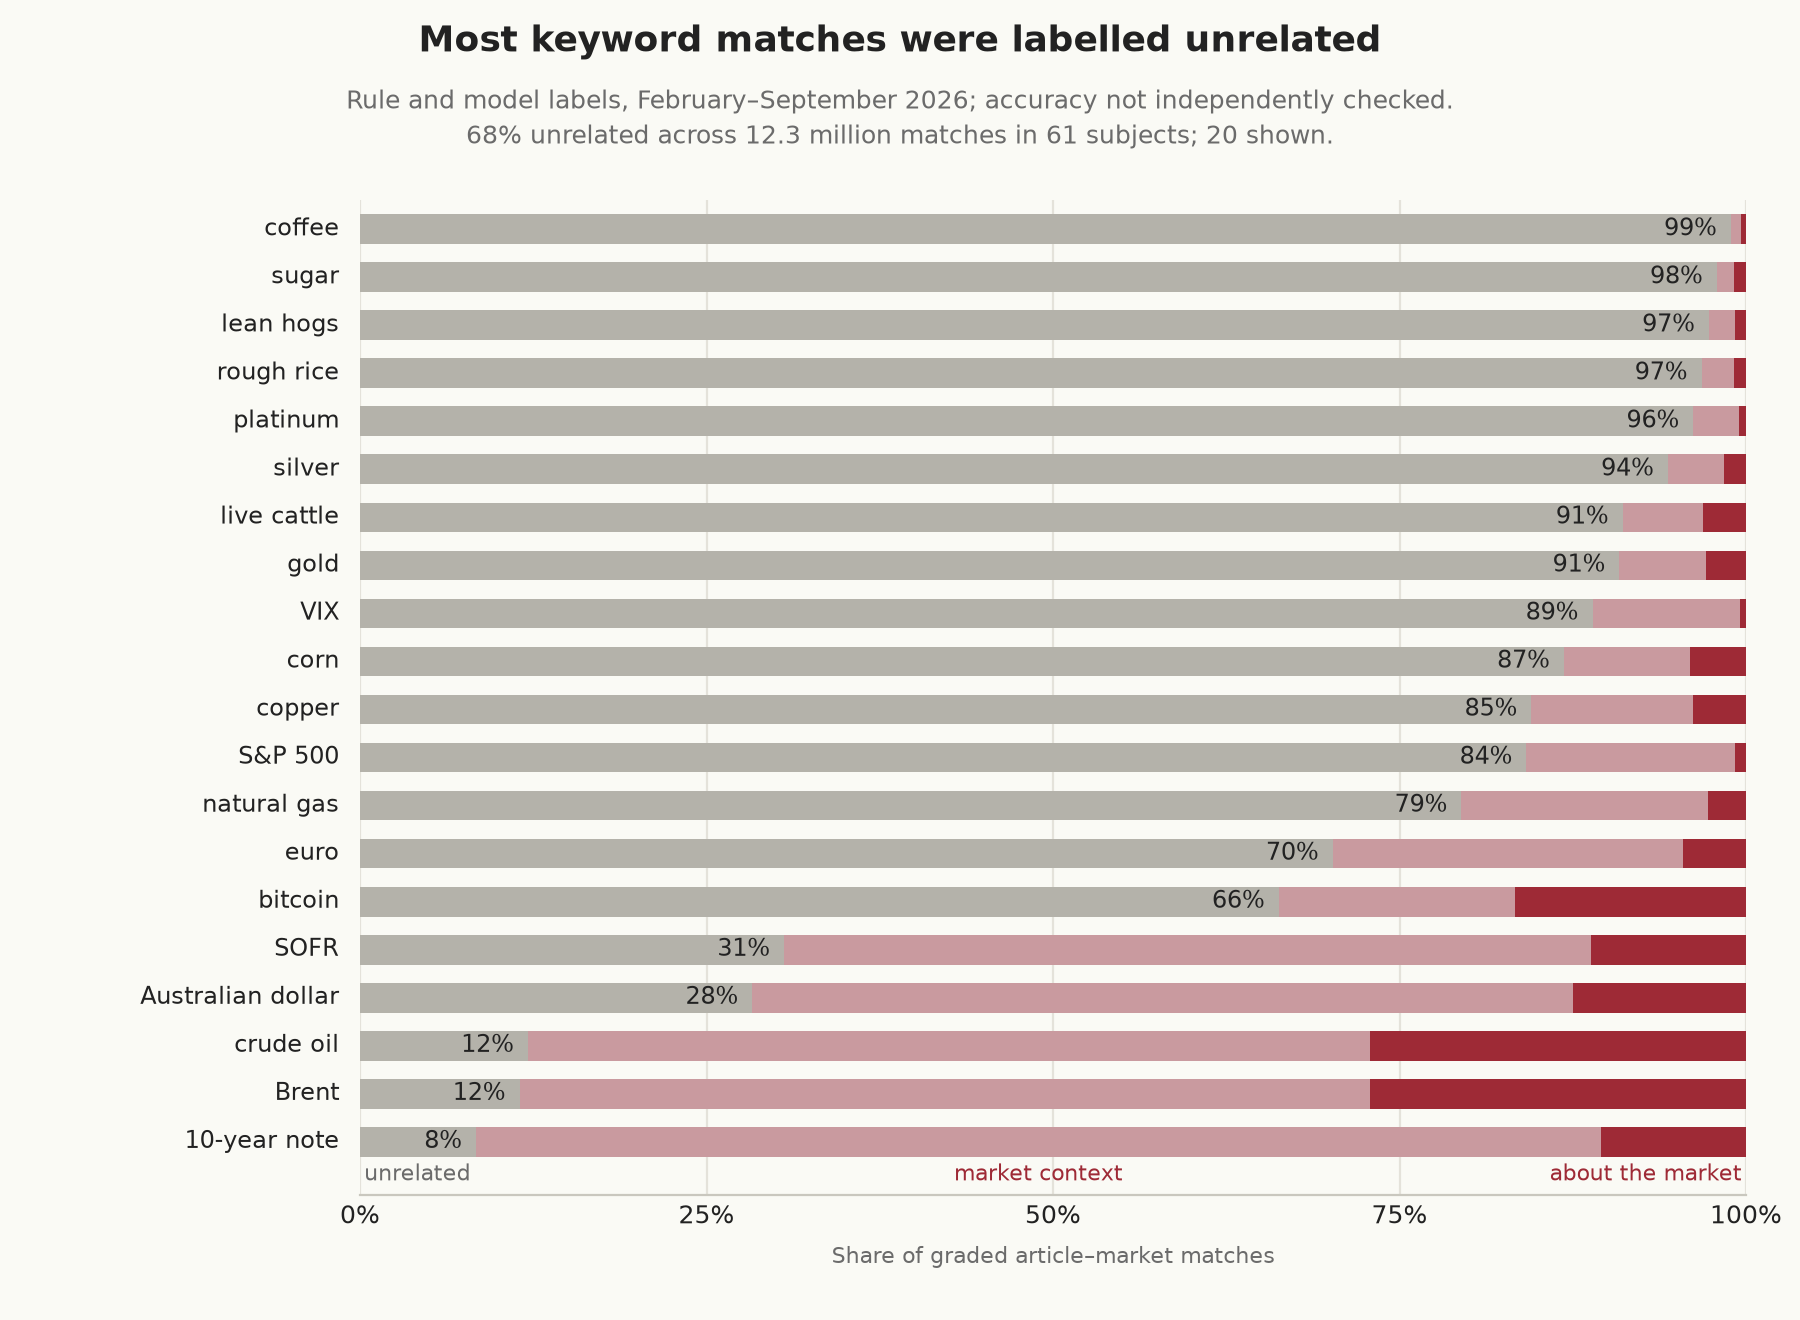
Broad terms find gold medals, people named Rice, and coffee recipes; “Treasury yields” is less ambiguous. Our rules and classifier labelled 68% of 12.3 million graded matches unrelated. These are overlapping article–market matches, and the labels haven’t been checked against an independent human-labelled sample. Millions of matches over eight months don’t provide millions of independent market episodes.
Topical relevance says nothing by itself about whether a story is new, bullish, or bearish, or whether price has already responded. A human review of rejected and accepted matches could help assess the labels, with duplicate and syndicated stories accounted for in a coverage measure. Query and classifier versions would be part of that record, alongside retrieval times: GDELT can add articles after their original publication dates.
Across the full nine-month backfill, grading cost about USD 150 and BigQuery queries about USD 75. The classifier, Claude Haiku 5.5, has a documented June 2026 knowledge cutoff, overlapping the earlier sample.4 That overlap creates a risk of historical contamination, though we haven’t established contamination in this relevance task. A prompt asking the model to ignore later events can’t verify that for us; freezing the model and evaluating subsequent data would give us a cleaner check.
LLMs might also help find sources and interpret unfamiliar formats, with their claims checked against the original material. Retaining the processed text and model version would leave a record of what was used. Access through a model or mirror doesn’t establish permission to store or reuse the underlying material.
Attention during the silver squeeze
Views of Wikipedia’s “Silver as an investment” rose during the January 2021 silver squeeze. The 635 views on 28 January were 2.7 times the preceding four-week median; views reached 3,088 on 1 February, during an episode in which silver prices were also moving.
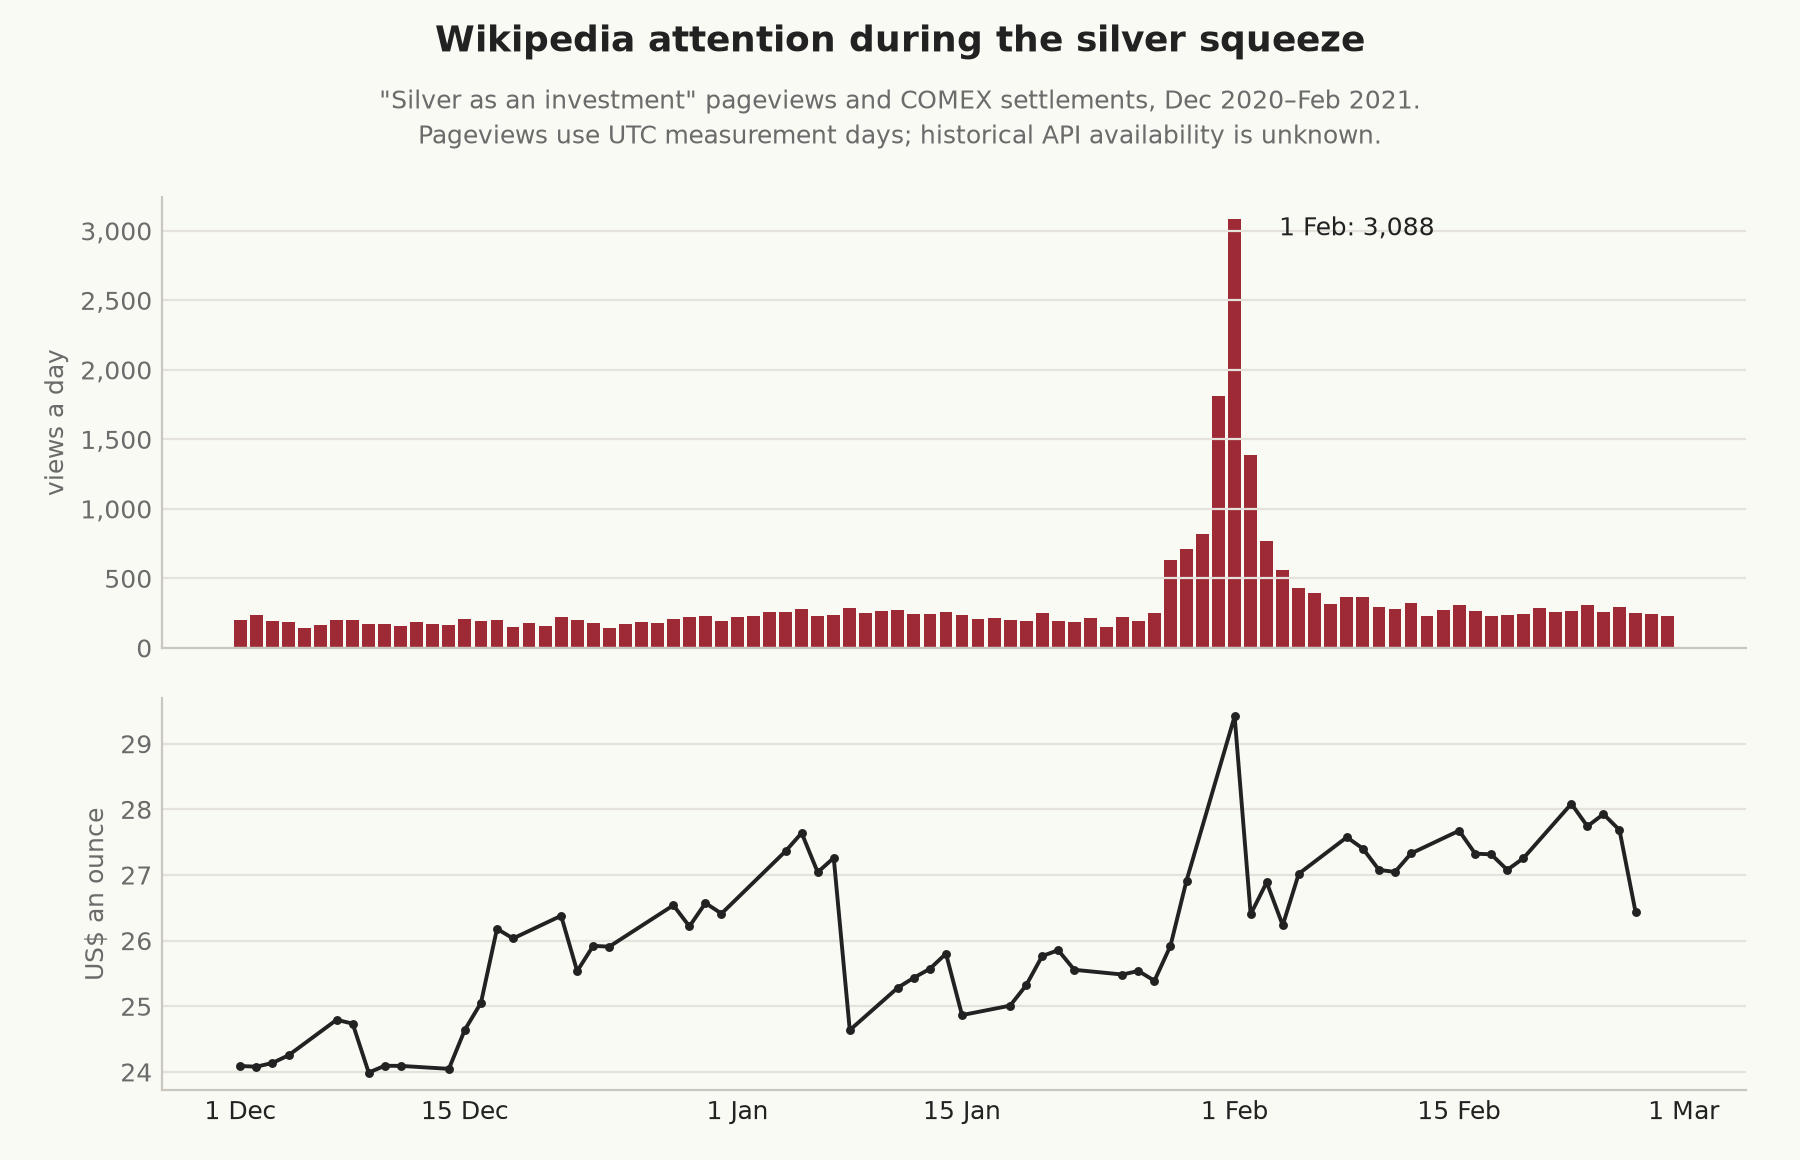
We chose the episode after the event to illustrate the change in attention. But we can’t establish
that a completed pageview count arrived before the relevant price response.
Thursday’s count couldn’t be complete before the UTC day ended at 6 pm Chicago time. Wikimedia
then needs time to load it, usually hours and sometimes 24 hours or more.5 We haven’t recovered
the actual availability times for this example. The user filter excludes identified bots only,
and Wikimedia can correct historical counts.
A signal test would start at a defensible availability time and ask what pageviews added beyond the price and volume already observed. It could cover pages and a period chosen beforehand, with occasions when attention rose without a later price move kept in the sample too. A weekday and seasonal baseline would help distinguish unusual interest from routine readership.
Using Google searches, Da, Engelberg, and Gao found short-term price pressure and later reversal for stocks.6 Challet and Bel Hadj Ayed found that arbitrary financial keywords did no better than unrelated ones, while reporting profitable strategies for other keywords and suitable assets.7 Neither study establishes a Wikipedia signal. Changes in how people seek information, including a move towards LLM conversations, could also change what pageviews measure; we haven’t tested whether that shift is occurring.
What a larger budget buys
Commercial feeds can answer questions beyond the coverage of public reports. Card transactions and foot-traffic estimates can help investigate retail sales; vessel tracking and satellite measurements of oil tanks can contribute to a regional supply balance. Web and app activity can be compared with company reports. Coverage and the representativeness of each panel need checking.8
Large firms also fund the people who maintain and research these inputs. Jim Simons described Renaissance taking in weather, company reports, and trading volumes in his 2015 TED interview.9 Two Sigma acquired Hivemind’s data-processing platform in 2022 and hired former staff.10 Those public accounts describe research operations, without revealing which feeds or combinations currently earn a return.
Sources to consider later
These prices were checked on 3 November 2026, in USD with monthly billing. Quote required means there is no published price for the relevant research feed.
| Source | Possible use | Pricing |
|---|---|---|
| GDELT | News events and coverage | Free; processing extra |
| Visual Crossing | Weather history and forecasts | Limited free tier; from USD 35/month |
| NewsAPI.ai | Article text, entities, and event clusters; archive from 2014 | From USD 90/month |
| Trading Economics | Economic indicators across countries | USD 199–399/month |
| Kpler | Cargo movements, inventories, and refinery activity | Quote required |
| Ursa Space | Satellite-derived oil storage | Quote required |
| Similarweb | Web and app activity mapped to companies | Quote required |
| Apptopia | App downloads, usage, and revenue | Quote required |
Visual Crossing’s historical forecasts cost an additional USD 165/month; historical weather alone doesn’t show what was forecast at the time. NewsAPI.ai charges more credits for archive searches. The practical cost would also depend on plan limits, bulk access, and retention rights. A sample could help establish whether the history contains the versions and timing evidence for a proposed test.
Worth the effort
Alternative data could add considerably to a trader’s or researcher’s understanding of a market, especially where it helps answer questions that price history leaves open. Building the skills to collect it, and a data library that a research platform can reuse, could also make later questions easier to investigate.
Maintaining that capability has a cost even when the data itself is free. Checking incoming releases and investigating gaps take time, and a publisher’s format change can mean another round of work on the collector. The responsibility for keeping old versions usable continues for as long as the research depends on them.
We’d argue that it’s worth taking on that cost to find out whether useful information can be extracted. Exploring demand or positioning alongside prices could give a trader a point of difference from the familiar search for another indicator variation on the same OHLCV bars.
Federal Reserve Bank of St. Louis, ALFRED help, including release-date provenance and vintage verification. ↩︎
Federal Reserve Bank of St. Louis, ICE BofA US High Yield Index Option-Adjusted Spread, notes on the three-year history restriction effective April 2026. ↩︎
GDELT data access. Our methods describe the February–September 2026 sample, grades, and denominators. ↩︎
Claude Haiku 5.5 model details. Our configuration uses
claude-haiku-5-5and promptrelevance-v1. ↩︎Wikimedia’s data-availability documentation and announcement of recomputed pageviews. Our query uses daily English Wikipedia views, all access methods, agent type
user. ↩︎Zhi Da, Joseph Engelberg, and Pengjie Gao, “In Search of Attention”, Journal of Finance 66(5), 2011. ↩︎
Damien Challet and Ahmed Bel Hadj Ayed, “Predicting financial markets with Google Trends and not so random keywords”, 2013, revised March 2014. ↩︎
Bloomberg’s alternative-data catalogue, Kpler’s trader tools, and Ursa Space’s data subscriptions describe these products. ↩︎
Jim Simons, TED interview, March 2015, especially 13:16–13:33 on data. ↩︎
Two Sigma, acquisition of Hivemind software, 24 August 2022. ↩︎